US Political Parties & Economic Results
Tagged:Investing
/
MathInTheNews
/
Politics
/
R
/
Statistics
People in the US keep saying, over and over: “Republicans are good for the economy”. But what does the data say?
Today’s Source: Simon Rosenberg
Simon Rosenberg (unrelated as far as I know to Willow Rosenberg, but I would be ecstatic to find a connection) is a prominent strategist for Democrats. You might argue that this makes his data biased, but:
- The “other side” is Republicans: now outright fascists
(as we’ve previously noted, that is now the viewpoint of mainstream scholars of fascism),
urging violence against elections. Do you really want to be “balanced” with that?
As I’ve been known to say to people,
“Once you identify the side with the Nazis, pick the other side.”
-
Rosenberg’s data comes from the US government’s Bureau of Labor Statistics (BLS), which frankly is beyond question as a data source on policy results.
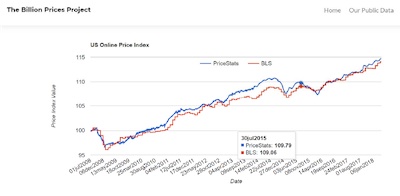
Even the conservative knotheads who think the BLS “games” inflation statistics had to back down when the independent MIT & Harvard Billion Prices Project came out in general agreement with the BLS over a decade and longer, as shown here. [1]
So: believe the well-proven data, ignore the ideologues.
Dataset du Jour

 So let’s have a look at what Rosenberg has to say today. [2]
He’s writing about today’s Economic News Release from the BLS. [3]
The Basic Facts of the BLS Report
So first let’s look at the facts, then at his interpretation. The facts are pretty good, in broad terms the economy is running nicely, and slowing down a bit to meet the Fed’s inflation targets:
- 187,000 new jobs in July
- Unemployment is at 3.5%, a near-record low
- Average hourly earnings up 0.4% for July (4.8% annualized) and 4.4% for the trailing 12 months
- Inflation is now at 3% over the trailing 12 months
So employment is good, wages are growing (slowly) after inflation, and it looks like the Fed will stick the landing without a recession.
Some Political Comparisons
The best response to a recital of data is: “Ok, so what?”
So this: let’s do some comparisons of Biden’s 3.5 year record with previous presidents, broken down by party. Yes, I know: the economy isn’t entirely under presidential control; it matters who holds the House & Senate, whether the Fed is sane, whether the big banks try to blow up the world as in 2007, whether there’s a pandemic, and so on. But if the comparison is especially compelling one way or the other, perhaps that can guide our political thinking along economic lines.
And the best comparisons make the choice obvious, with no need for advocacy. As a statistician, I always aimed to make the choice obvious for my client. Let’s see if there’s an honest path to that.
Rosenberg looked back to 1989 (the senior Bush’s administration) up through the present. That means everything since the end of the Cold War; going back further would be comparing to a very different era. The comparisons will be Republicans, Democrats other than Biden, and Biden. The idea is to ask 2 questions:
- Are Republicans different from Democrats?
- Is Biden any different from previous Democrats?
Job Creation Rates and Their Integrals
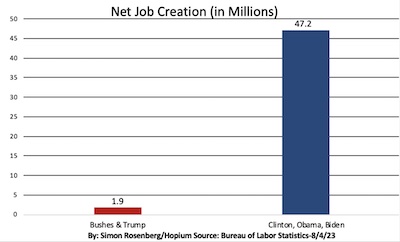 First, let’s just consider the net total of jobs created since the end of the Cold War:
about 49 million jobs. How those break down between Republican and Democratic
administrations is as Rosenberg shows here.
An overwhelming $100\% \times 47.2 / 49.0 = 96.3\%$ were created under Democrats, i.e., pretty much all of them.
A minor caveat: over this time period (1989 - 2023) we had 16 years of Republicans (Bush, Lesser Bush, and Trump) vs 18.5 years of Democrats (Clinton, Obama, and 2.5 years of Biden). That gives Democrats a slight advantage, but not enough to overcome a split of 96.3% vs 3.7%.
Do you need a fancy-pants statistician to tell you those are different? No. Is that gonna stop us? Also no.
The null hypothesis here is that the true probability of creating a job under either party is 50%, and we got data as biased as this just by chance. A small $p$-value will indicate that the null hypothesis is unlikely, and jobs are linked to presidential party.
> prop.test(47.2e+06, 49.0e+06)

	1-sample proportions test with continuity correction

data:  47200000 out of 4.9e+07, null probability 0.5
X-squared = 42064488, df = 1, p-value < 2.2e-16
alternative hypothesis: true p is not equal to 0.5
95 percent confidence interval:
 0.9632126 0.9633179
sample estimates:
        p
0.9632653
This test reports there is a probability that the parties are the same at job creation of $p \sim 2.2 \times 10^{-16}$. (Though actually, that’s just the smallest $p$ R will report. If you dig into the test, you find $p \sim 0.0$. R is just too embarrassed to report $p$-value that small.)
So basically there’s no chance whatsoever that the parties are the same; Democrats are definitely better.
Let’s get some Bayesian confidence limits (“credibility limits” to the cognoscenti) on that figure of 96.3% of jobs created during Democratic administrations. If we assume the prior distribution of $p$ is uniform, then the posterior distribution of $p$ is Beta, as we’ve done many times before on this Crummy Little Blog That Nobody Reads (CLBTNR). (See, e.g., the 2022-Nov-30 post on sizes of factions in the 2020 election.)
> N <- 49.0e+06  # Jobs created
> K <- 47.2e+06  # Jobs created under Democrats

> pmin <- 0.9625; pmax <- 0.9635 # Range where posterior Pr(p) is reasonably nonzero
> ps   <- seq(from = pmin, to = pmax, length.out = 1000)
> prps <- dbeta(ps, shape1 = K + 1, shape2 = N - K + 1)
> pMAP <- ps[which.max(prps)]  # Max A posteriori Proability estimator
> pCL  <- quantile(rbeta(1000, shape1 = K + 1, shape2 = N - K + 1), probs = c(0.025, 0.975))

> source("../../tools/graphics-tools.r")
> withPNG("../images/2023-08-04-us-parties-econ-prob-jobs-posterior.png", 600, 300, FALSE, function() { withPars(function() { plot(ps, prps, type = "l", lty = "solid", col = "blue", xlim = c(pmin, pmax), ylim = c(0, max(prps)), xlab = "p", ylab = "Density", main = "Posterior Beta Distribution: Democratic Job"); abline(v = pMAP, lty = "dashed", col = "red"); abline(v = pCL, lty = "dashed", col = "black"); legend("topleft", inset = 0.01, bg = "antiquewhite", legend = c(sprintf("Job MAP: %.5f", pMAP), sprintf("95%% CL:   %.5f - %.5f", pCL[[1]], pCL[[2]])), col = c("red", "black"), lty = "dashed", lwd = 2) }, pty = "m", bg = "transparent", ps = 16, mar = c(3, 3, 2, 1), mgp = c(1.7, 0.5, 0)) })
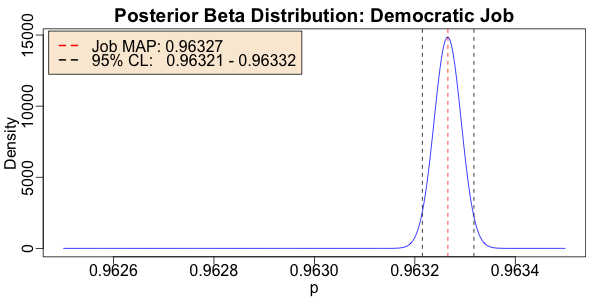 … and here’s the result.
This assumes we start with no idea at all of the probability that a job might be created under Democrats (an “uninformative prior”, here a uniform distribution over $[0, 1]$). Then, after 49 million observations of job creation, we ask how we should update our beliefs. Bayes Rule leads us to the posterior Beta distribution shown here.
We conclude that the probability a given job was created under Democrats is 96.327%. How certain are we about that? The 95% confidence limit here is 96.321% – 96.332%, so… pretty darn certain.
Conclusion: Almost all the job growth in the last 35 years has been under Democratic presidents, and the data on that is very convincing.
Splitting Out Biden
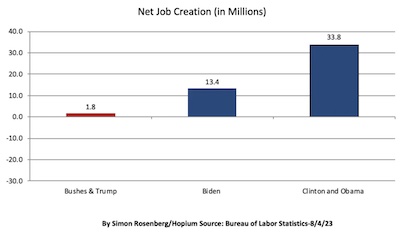 Now let’s split out Biden from the other Democrats Clinton & Obama. The net job
creation totals that Rosenberg shows here show the Republicans as the clear failures,
Democrats as the clear winners, and Biden between.
However, these are total job creations over the life of an administration, and they are not the same lengths of time: 16 years of Bush, Lesser Bush, and Trump vs 16 years of Clinton and Obama vs 2.5 years of Biden. So Biden’s got the shortest amount of time here. Even so, Biden has created 13.4 / 1.8 = 7.44 times as many jobs as Bush + Lesser Bush + Trump combined. Further more, he’s done so in 2.5 years instead of 16 years, i.e., at a much higher rate.
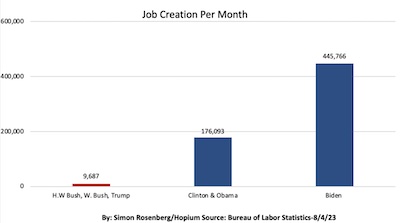
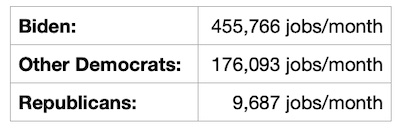 If we look at the rate of job creation per month, as Rosenberg shows here, this becomes
clear. We see that Biden is the clear leader of the pack, once we’ve corrected for his
fewer years in office.
And it’s not by just a little, but by a lot, as we see in the table!
Some of this, of course, is period-dependent: Biden managed to hoist us out of COVID-19 by getting us (mostly) vaccinated. The real test will be upon his re-election, what the next four years bear.
Conclusion: In job creation, both total number and monthly rates, Democrats are way better than Republicans, and Biden is even better than other Democrats. Whether Biden’s excellence is the luck of period selection or not, the broad conclusion that Democrats are better than Republicans is very clear.
Unemployment Rates
That’s the story on job creation. How about unemployment?
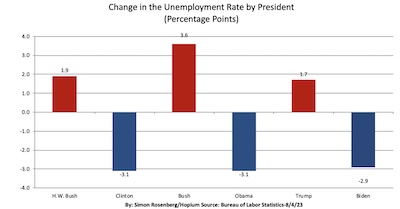 Here the evidence looks even more damning, if possible.
Rosenberg’s bar plot here shows the change in unemployment (up is bad, down is good) for the 6 presidents in question. Note that: (a) all bars are well-bounded away from 0, i.e., each president did something, and (b) Republicans bad, Democrats good.
That way of putting it is about as obvious as blunt-force trauma. There’s really no for formal statistical testing here, right?
Again: Do you need a fancy-pants statistician to tell you those are different? No. Is that gonna stop us? Also no.
First, we approach this subject with a bit of trepidation:
- These presidents served for different lengths of time. We need to adjust for that, giving higher weight to presidents with longer terms vs shorter ones. We do that below, and note that because Biden has not finished his first term, this weighting disadvantages Biden. We’re trying to be fair here, not to make a pro-Biden case.
- There are only 6 data points! That means it will be very hard to achieve statistical significance. However, the effect size is pretty large, so maybe it’ll work.
First, let’s put together in R a dataframe of the data, with a new column that weights the unemployment change by the length of the presidential term:
> unempl <- transform(data.frame(Party = c("Repub", "Dem", "Repub", "Dem", "Repub", "Dem"), UnemplChg = c(1.9, -3.1, 3.6, -3.1, 1.7, -2.9), Terms = c(1.0, 2.0, 2.0, 2.0, 1.0, 2.5/4.0)), UnemplChgWt = UnemplChg * Terms); unempl
  Party UnemplChg Terms UnemplChgWt
1 Repub       1.9 1.000      1.9000
2   Dem      -3.1 2.000     -6.2000
3 Repub       3.6 2.000      7.2000
4   Dem      -3.1 2.000     -6.2000
5 Repub       1.7 1.000      1.7000
6   Dem      -2.9 0.625     -1.8125
Next, we’ll do a simple $t$-test to see if the difference in means between Republicans and Democrats is likely to be real (in fact 1-sided, to make it even harder, testing only if Democrats did better):
> t.test(UnemplChgWt ~ Party, data = unempl, alternative = "less")

	Welch Two Sample t-test

data:  UnemplChgWt by Party
t = -3.5938, df = 3.8384, p-value = 0.01227
alternative hypothesis: true difference in means between group Dem and group Repub is less than 0
95 percent confidence interval:
      -Inf -3.331244
sample estimates:
  mean in group Dem mean in group Repub
            -4.7375              3.6000
 This gives is $p \sim 1.2\%$, so we’re more than adequately below 5%, the traditional
threshold for statistical significance. The difference is real. Interesting that with
only 6 lousy data points, we’re statistically significant.
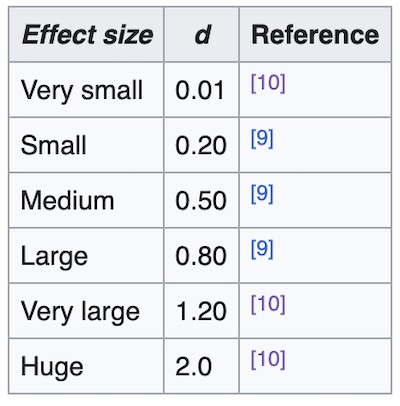
Next let’s check if the effect size is really all that big, with Cohen’s $d$, as we previously did when examining executive branch criminal indictments by party. Recall that Cohen’s $d$ can be positive or negative, and only the absolute value matters.
> library("effectsize") # For cohens_d()
> print(cohens_d(UnemplChgWt ~ Party, data = unempl)); cat("\n")
Cohen's d |         95% CI
--------------------------
-2.93     | [-5.40, -0.35]

- Estimated using pooled SD.
Using the interpretive table from Wikipedia shown above, our value of -2.93 (CL: -5.40 – -0.35) is not only bounded away from 0, but the maximum likelihood estimator for the Cohen $d$ statistic is bigger than “huge”.
I propose we call this a “honkin’ big” effect.
Conclusion: Appropriately weighted for length of presidential terms, Democrats make unemployment better, Republicans worse. This is statistically significant, and a “honkin’ big” effect size.
Annualized GDP Growth
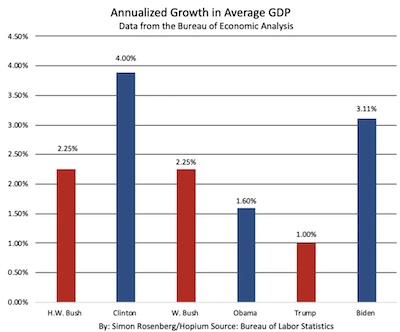 Does the effect extend beyond employment, say to GDP of the whole economy?
Here’s the data:
- Clinton and Biden obviously outshine all the Republicans.
- Obama? Ok, special case: he inherited an economy that had just crashed into the Great Recession. (Largely because Republicans had removed all the Depression-era safeguards, so it was only a matter of time.) Just not having a Depression was a spectacular win.
Should we analyze this formally? No. Are we gonna calm down and skip it? Also no.
Again, we first transform the data to weight the GDP change over an administration by the number of terms in office. Then, the classic $t$-test is classic for a reason:
> gdp <- transform(data.frame(Party = c("Repub", "Dem", "Repub", "Dem", "Repub", "Dem"), GDPChg = c(2.25, 4.00, 2.25, 1.60, 1.00, 3.11), Terms = c(1.0, 2.0, 2.0, 2.0, 1.0, 2.5/4.0)), GDPChgWt = GDPChg * Terms); gdp
  Party GDPChg Terms GDPChgWt
1 Repub   2.25 1.000  2.25000
2   Dem   4.00 2.000  8.00000
3 Repub   2.25 2.000  4.50000
4   Dem   1.60 2.000  3.20000
5 Repub   1.00 1.000  1.00000
6   Dem   3.11 0.625  1.94375

> t.test(GDPChgWt ~ Party, data = gdp, alternative = "greater")

	Welch Two Sample t-test

data:  GDPChgWt by Party
t = 0.85192, df = 3.125, p-value = 0.2273
alternative hypothesis: true difference in means between group Dem and group Repub is greater than 0
95 percent confidence interval:
 -3.088738       Inf
sample estimates:
  mean in group Dem mean in group Repub
           4.381250            2.583333
We notice 3 results:
- The overall statistical significance is $p \sim 22.7\%$, i.e., not statistically significant.
- However, the mean of the (term-weighted) GDP change shows a very large difference: 4.38 for Democrats vs 2.58 for Republicans.
- Q: How can such a large effect not be statistically significant? A: When your dataset has only 6 data points, and one of those is wounded by inheriting the Great Recession (Obama).
Conclusion: Empirically, it certainly appears Democrats are enormously better for GDP growth than Democrats. However, with only 6 data points and one compromised by the accident of the Great Recession overlapping the term change, we cannot say with certainty that this is statistically significant.
(Ah, well: at least you know we’re being honest.)
Budget Deficit
As to the budget deficit, this is a favorite Republican talking point: during Democratic administrations they go on and on about it to hamstring Democratic policies; but during Republican administrations they quote Dick Cheney when he said “Deficits don’t matter. Reagan showed that.” The inconsistency is obvious to all but the cult members themselves.
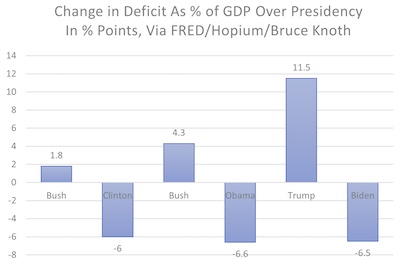 Here’s the data Rosenberg has for us. Just visually, the conclusion is obvious:
- Under Democrats Clinton, Obama, and Biden, the budget deficit fell.
- Under Republicans Bush, Lesser Bush, and Trump the budget deficit rose.
- As with our analysis of executive branch criminal indictments, Trump is an outlier even against that Republican background.
Does this need formal Testing? No. Gonna walk past this one? Also no.
Again, we weight the change in deficit growth rate per year by the number of terms of each administration.
> deficit <- transform(data.frame(Party = c("Repub", "Dem", "Repub", "Dem", "Repub", "Dem"), DeficitChg = c(1.8, -6.0, 4.3, -6.6, 11.5, -6.5), Terms = c(1.0, 2.0, 2.0, 2.0, 1.0, 2.5/4.0)), DeficitChgWt = DeficitChg * Terms); deficit
  Party DeficitChg Terms DeficitChgWt
1 Repub        1.8 1.000       1.8000
2   Dem       -6.0 2.000     -12.0000
3 Repub        4.3 2.000       8.6000
4   Dem       -6.6 2.000     -13.2000
5 Repub       11.5 1.000      11.5000
6   Dem       -6.5 0.625      -4.0625
Next, we’ll do our 1-sided $t$-test to see if budget deficits are any lower among Democrats than Republicans:
> t.test(DeficitChgWt ~ Party, data = deficit, alternative = "less")

	Welch Two Sample t-test

data:  DeficitChgWt by Party
t = -4.2007, df = 4, p-value = 0.006844
alternative hypothesis: true difference in means between group Dem and group Repub is less than 0
95 percent confidence interval:
      -Inf -8.399244
sample estimates:
  mean in group Dem mean in group Repub
          -9.754167            7.300000
Yup: $p ~\sim 0.68\%$, which is comfortably statistically significant. Also look at the huge difference in means by group: is this effect really that big? Let’s find out, with our new friend Cohen’s $d$:
> library("effectsize") # For cohens_d()
> print(cohens_d(DeficitChgWt ~ Party, data = deficit)); cat("\n")
Cohen's d |         95% CI
--------------------------
-3.43     | [-6.17, -0.59]

- Estimated using pooled SD.
Yes indeed: $d$ is well-bounded away from 0, and is large in absolute value. How large? The table above told us that 2 was “huge”, and we named 2.90 “honkin’ big”, so we need yet another term to describe how astronomically large this effect is. How about “gigantimundo”?
Conclusion: Appropriately weighted for length of presidential terms, Democrats make the deficit better, Republicans worse. This is statistically significant, and a “gigantimundo” effect size.
So Why Isn’t Anybody Happy?
But, but, but… if the economy’s so good, why isn’t anybody happy?
First, introductory econ courses notwithstanding, there are other things to life than economic variables like jobs, GDP, and deficits. The world is in a dark place now: the Russian war in Ukraine, catastrophic climate change, revenant fascism, unaligned AI under corporate control, the US soaked in blood from all the guns, politicians not even vaguely rational, and so on. Whatever the state of the economy, those are enough to make you view the future with foreboding.
Second, sure a flat-screen TV is affordable. But: inflation-adjusted wages are stagnant or down for decades, while housing, child care, health care, education, and retirement are priced out of range. You can get a few luxuries, but people have trouble affording necessities like those, or even basics like food and winter heat.
We have an economy which, on average, is performing nicely. We also have massive economic inequality which means the average means little. Most of the benefits accrue to the already prosperous to the über-wealthy.
Most of us are unhappy because of that, whether we realize it or not.
The Weekend Conclusion
We often have to weigh both economic issues and moral issues, i.e.,
- “Is this government policy right/fair/compassionate?” and
- “Is this government policy going to make it possible for me to have enough money?”
In this analysis, we see that the economic and moral issues both pull in the same direction: away from Republicans, and toward Democrats.
Look, here at Château Weekend we’re investors nowadays, like many American retirees. It’s nice to see money and morality pulling in the same political direction, for once!
In the meantime, consider the alternative.
PBS has an interview [4] with Ruth Ben-Ghiat, an NYU professor specializing in authoritarianism. Trump advisors, such as former OMB Director Vought, are “trying… to identify the pockets of independence and seize them,” a classic example of what’s called autocratic capture. All power is concentrated in the dictator, and personal loyalty to the dictator is the only virtue.
 Thought it was bad last time? He just thinks he wasn’t autocratic enough last time, and
promises to be a more efficient fascist this time. Consider the following
multiply-sourced information from senior political reporters at
Rolling Stone [5 (yeah, I know; read the footnote)], and
tell me you’re not terrified of literal iron-fisted fascist rule:
Rosters full of MAGAfied lawyers are being assembled. Plans are being laid for an entire new office of the Justice Department dedicated to “election integrity.” An assembly line is being prepared of revenge-focused “special counsels” and “special prosecutors.” Gameplans for making Smith’s life hell, starting in Jan. 2025, have already been discussed with Trump himself. And a fresh wave of pardons is under consideration for Trump associates, election deniers, and — the former president boasts — for Jan. 6 rioters.
…
Sources familiar with the situation tell Rolling Stone that Trump and his close ideological allies — working at an assortment of MAGA-prone think tanks, advocacy organizations, and legal groups — are formulating plans for a wide slate of “special prosecutors.” In this vision, such prosecutors would go after the usual targets: Smith, Smith’s team, President Joe Biden, Biden’s family, Attorney General Merrick Garland, FBI director Christopher Wray. But they’d also go after smaller targets, from members of the Biden 2020 campaign to more obscure government offices.
…
Putting it another way: “What we’re trying to do is identify the pockets of independence and seize them,” Russ Vought, a former top Trump official who heads the Center for Renewing America, told The New York Times in a story published last month.
 DeSantis, running for dictator in second place, has blurted out so many fascist talking
points they’re too cartoonish to enumerate. He’s said he wants to extend autocratic
capture (“do a more thorough job at dictator than Trump”) by abolishing some agencies
& taking personal control. No checks & balances necessary if they get in his
way.
While autocratic capture of power centers is one aspect of fascism, veiled and eventually explicit calls to violence are another. In a recent campaign vow reported in The Hill [6], he vowed to “start slitting throats on day one” as a way of thinning out Federal agencies. Asked to “clarify”, he said by way of example that it would be a mistake to put a former military officer in charge of Defense, because “… they may have to slit some throats” and it would be harder if they were former colleagues.
So not only does he want department heads who are incompetent because they lack the relevant experience, but his metaphor for management is murder.
That’s… not much of an alternative!
The data we’ve seen today makes the appeal that if (a) you don’t want to live under a dictator and (b) you’d like a prosperous economy, then the voting choice is quite obvious. Rosenberg, McLean, and Taylor have put together a presentation called With Democrats Things Get Better [7] that makes this point and most of the other ones in this post to other Democratic campaign staff. It’s worth a watch.
Notes & References
1: M Chinn, “What Does Judy Shelton Believe GDP Growth and Inflation Are in 2019?”, Econ Browser blog, 2019-Jul-19. ↩
2: S Rosenberg, “August Jobs Report - Steady Growth, Strong Earnings Gains, Unemployment Down to 3.5%”, Hopium Chronicles blog, 2023-Aug-04. ↩
3: US BLS Staff, “Employment Situation Summary”, US Bureau of Labor Statistics, 2023-Aug-04. ↩
4: L Barrón-López & T Conciatori, “Trump plans to massively expand executive power if elected, report says”, PBS News Hour, 2023-Jul-19. ↩
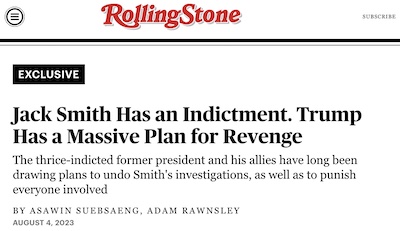
5: A Suebsaeng & A Rawnsley, “Jack Smith Has an Indictment. Trump Has a Massive Plan for Revenge”, Rolling Stone, 2023-Aug-04.
I still can’t get used to the idea of Rolling Stone as a source of cutting-edge political reporting. But ever since the Great Recession and their report on Goldman Sachs, that’s been the case. ↩
6: J Manchester, “DeSantis vows to ‘start slitting throats on day one’”, The Hill, 2023-Aug-03. ↩
7: S Rosenberg, G McLean, C Taylor, “With Democrats Things Get Better”, presentation recorded at Hopium Chronicles blog, 2023-Jul-20. ↩

Gestae Commentaria
Comments for this post are closed pending repair of the comment system, but the Email/Twitter/Mastodon icons at page-top always work.