US Executive Branch Criminal Indictments, Broken Down by Party
Tagged:CatBlogging
/
MathInTheNews
/
Politics
/
R
/
Sadness
/
Statistics
Do Democratic or Republican presidencies in the US result in more executive branch criminal indictments per year in office? We all think we know, but let’s consult the data.
The Question
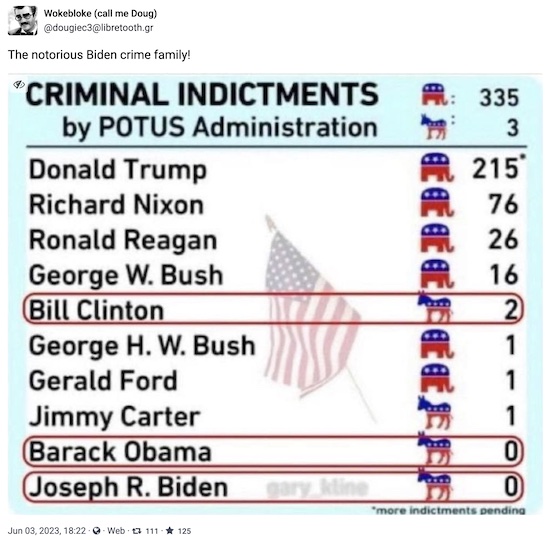
Someone in my circles boosted this a while back, from somebody I don’t know, but who had a couple of interesting bits of data [1]:
And I thought, “Hey, that’s data, right there. We like data! We know what to do with data…” That led to some thoughts on the subject of whether we have enough data to show statistically that there is both significance (real & reproducible) and an effect size (big enough difference) that matters.
An initial guess: we all know Republicans are more corrupt, so it’s gotta come out that way. On the other hand, there are only N=10 data points here, so it’s dicey.
- If it does come out significant, it’s utterly damning;
- if it comes out marginally significant, it’s just because we’ve reduced the data to 10 points;
- if it comes out not at all significant, then Republicans are in the clear, and we gotta go clean up our prejudice against them. (Hey, it could happen…)
It makes some degree of sense to look at executive branch criminal indictments by presidential party, since the President gets to appoint many of the executive branch people. Do they appoint honest people, or not? Let’s find the quantitative version of that root question.
So, the question: Is it really & likely reproducibly the case (statistical significance) that Republican administrations have more executive branch indictments? If so, is it by a lot on some reasonable scale, or just a little bit (effect size)?
The Answer
In spite of our annoyingly persistent mild cognitive impairment, depression, and now what feels like bronchitis, we want to return to our mathematical roots here on this Crummy Little Blog That Nobody Reads (CLBTNR).
So, of course, we wrote an R script. [2] You can peer review it, and the transcript that it writes, at your leisure. If you want to run it yourself, you’ll need a couple libraries from me, which I’ll be happy to supply.
We’re going to believe the mysterious Doug’s data at face value. This is not especially rash, because it can be easily checked. If any of you have complaints in that regard, check the data first, and send me a pointer to your sources. I’ll cheerfully update. (If you just complain without doing the checking work yourself, I’ll just ignore you, cheerfulness optional.)
We’ve added the number of years each president was in office, and computed a new column of the number of indictments per year in office. If we assume a constant rate of criminality, then the number of indictments should be higher for an 8-year administration than for a 4-year administration of similarly low morals.
Here’s what the data looks like, when loaded into R, sorted into decreasing order by number of indictments per year in office:
   Party President NIndicted YrsInOffice NIndictedPerYr
1      R     Trump       215           4          53.75
2      R     Nixon        76           6          12.67
3      R    Reagan        26           8           3.25
4      R     Bush2        16           8           2.00
7      R      Ford         1           2           0.50
5      D   Clinton         2           8           0.25
6      R     Bush1         1           4           0.25
8      D    Carter         1           4           0.25
9      D     Obama         0           8           0.00
10     D     Biden         0           3           0.00
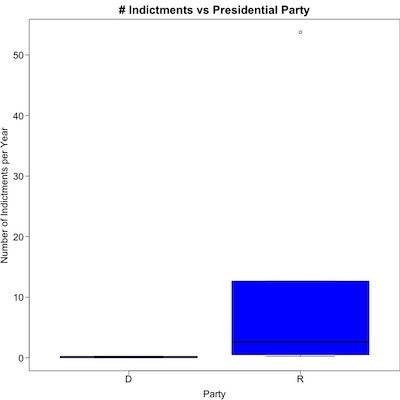
Let’s have a look!
What you see here (click to embiggen) is a boxplot of the rate of criminal indictments per year, separated for Democratic and Republican presidents.
- The horizontal black bar is the median.
- The blue box is the 25th percentile to the 75th percentile, representing the “typical” variation of the number of indictments.
- Normally there would be whiskers showing a wider degree of variation, but here they’re right up against the blue boxes.
- That lone circle way up in the upper right is an “outlier”: so far from the crowd that it’s just off on its own.
The outlier is important, because it’s the Trump administration. Apparently the “exceptionally stable genius” ran an “exceptionally criminal administration”. We seek here to know if his party is also like that (to a lesser degree), or if it’s just him.
Statistical Significance: Is the Effect Real & Likely to Reproduce?
Statistical significance is a reality check. You want to know if you do the experiment again – say, by electing another Republican – whether the pattern would continue, or whether it’s just a fluke of this particular dataset. We’re asking if the effect is real.
We’ll use a simple, and utterly standard, t-test to decide if the average rate of criminality is different between the 2 parties. Here we’ve done the Welch variant (unequal variances, as the boxplot above makes clear). Also, we’re doing a 1-sided test, where we only get significance if the rate is larger for Republicans, and not the other way – this is just being fair, since it’s exactly the thing we want to know (and is also supported by the boxplot above).
	Welch Two Sample t-test

data:  NIndictedPerYr by Party
t = -1.3978, df = 5.0007, p-value = 0.1105
alternative hypothesis: true difference in means between group D and group R is less than 0
95 percent confidence interval:
     -Inf 5.273595
sample estimates:
mean in group D mean in group R
        0.12500        12.06944
So we have p∼11% or so. That’s not statistically significant, by the usually reasonable standard of less than or equal to 5%. It’s… sorta-kinda-maybe approaching significance, but doesn’t quite get under the bar.
How might we quantify that? We start by looking at the effect size. The mean number of criminal indictments per year in office is 0.125 for Democrats, and 12.07 for Republicans. That’s a huge difference!
When you have a large-ish effect size but just barely fail to reach statistical significance, that’s a signal that your dataset is too small.
Yep, we got ourselves the only-est dataset of a measly 10 points, no more.
So the effect looks marginally real, but disturbingly large. [3]
Effect Size: Is the Effect Big Enough to Matter?
Effect size is a different animal from statistical significance. With huge datasets, one might attain statistical significance at measuring very, very tiny differences that are no import. So with an effect size statistic, we seek to know if the (marginally) significant effect is “big enough to matter”.
For a difference of means, the canonical thing is Cohen’s d statistic. In the case where variances are equal, it’s basically a Z-transform: compare the mean difference to the standard deviation. In the unequal variance case, it’s a bit gnarlier, using a pooled variance, but essentially the same idea.
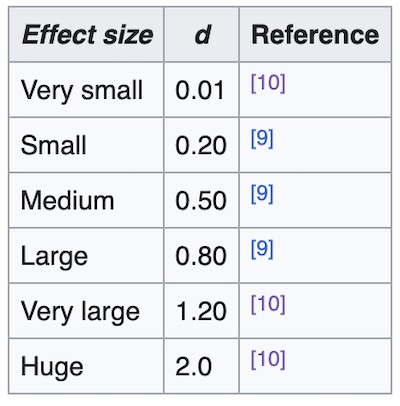 In terms of interpretation, Wikipedia refers us to a paper by
Sawilosky [4] which itself builds on Cohen’s work. The table
to the right says anything around 0.8 is a pretty good-sized effect. (Note that Cohen’s
d can be negative as well. That just means the mean difference went the other way.
It’s the absolute value of d that matters.)
To compute this, we used the nice new effectsize library in R. Here are the results:
Cohen's d |        95% CI
-------------------------
-0.72     | [-2.01, 0.61]
So again, it’s not quite statistically significant, since the 95% confidence interval spans 0. That’s unsurprising. But the (absolute) mean value of 0.72 is, in the table above, a pretty large effect.
So we’ve confirmed our conclusion: we do not quite reach statistical significance because of the small (N=10) dataset size, but the effect size is pretty large. That biases us in the direction of believing the hypothesis of Republican criminality vs the null hypothesis of equal criminality in both parties.
The Weekend Conclusion
Yes, it’s not a slam-dunk. But then… with only 10 data points, what did you think would happen? We have to look at trends, and whether we’re near significance and effect size cutoffs.
It appears that the Trump administration was quite heavily larded with criminals, even by Republican standards, which are already remarkably low. He’s an outlier, i.e., he ran an exceptionally criminal administration.
 There’s a weird bit of American slang, meaning you’ve revealed a secret: you’ve
‘let the cat out of the bag’. No idea why people put cats in bags in the first place.
Except that somehow the Weekend Publisher, weird kid that he is, likes being put in a
bag and carried around the house. As you can see here, he is not cooperating with the
metaphor, because he prefers being inside the bag. Try to take him out, and… he
will cut you.
As with most American management, cooperation is… well, let’s just say it’s not his strongest suit. Also… cat.
 In a similar fashion, we haven’t exactly “let the cat out of the bag” here by looking at
indictments by the executive’s party, and evidence of bias toward Republican criminality!
We all know this. (At least those of us not deluded by tribal loyalties, which are, after
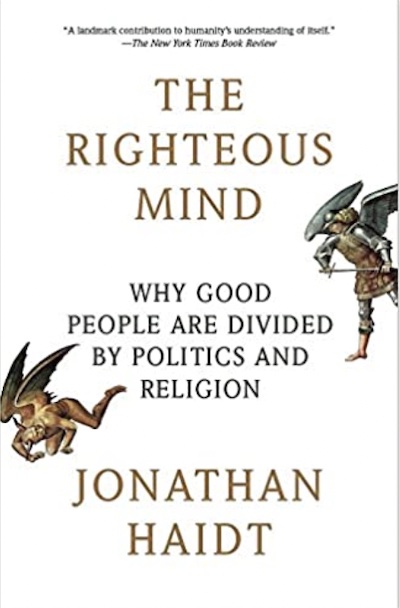
all, one of factors of moral sensibility in Jonathan Haidt’s
The Righteous Mind. [5])
But now, we have quantitative knowledge about this. As Lord Kelvin explained almost a century and a half ago, that’s the beginning of real knowledge.
Maybe we should do something with that real knowledge. Like never, ever voting Republican. Not for any conceivable office. Not under any imaginable circumstance.
Never, ever, forever: Factio Republicana delenda est! [6]
I used to be a conservative. Since Reagan, I’m not. I’m just sorry I was such a slow learner.
Notes & References
1: WokeBloke (call me Doug), “The notorious Biden crime family!”, Mastodon as @dougiec3@libretooth.gr, 2023-Jun-03. ↩
2: Weekend Editor, “R script to evaluate executive branch criminal indictments by President’s party”, Some Weekend Reading blog, 2023-06-12.
NB: There is also a text file transcript of running this thing, so you can check for yourself whether it says what I said it says.
Also, it loads a few magic swords from my personal box of magic swords; if you want to reproduce it yourself I’d be happy to email you a magic sword or two. Email/Twitter/Mastodon links are at the top of each page.↩
3: Yes, one could attempt to achieve significance by means of dataset surgery. We could, for example, argue that Ford and Bush1 were “old-school” Republicans (but that the famously corrupt Nixon was not). This is a bad idea on 2 grounds:

- You still won’t achieve statistical significance, because now you’re down to just N=8 data points.
- Also, you’re excising inconveniences to torture the data into telling you what you want to hear. This deserves a sound Car Talk dope slap with a rolled-up newspaper, and a firm “No! Bad analyst! Bad, bad!”
(And yes, because I personally checked this, you can rest assured I also self-administered the requisite percussive maintenance personally, so you don’t have to.) ↩
4: S Sawilowsky, “New effect size rules of thumb”, Jnl Mod Appl Stat Meth 8:2, 2009, pp. 467–474. DOI:10.22237/jmasm/1257035100. ↩
5: J Haidt, The Righteous Mind, Vintage Books, 2013 ↩
6: That whirring sound you hear is Cato the Elder, turning over in his grave at high RPM. Maybe we can get some green power if we hook him up to a generator? ↩
Gestae Commentaria
Comments for this post are closed pending repair of the comment system, but the Email/Twitter/Mastodon icons at page-top always work.