Updated3: Ukrainian Estimates of Russian Casualties Hit 200k
Tagged:MathInTheNews
/
R
/
Sadness
/
Statistics
Today the world reached yet another grim milestone in Russia’s invasion of Ukraine.
The Milestone (Or, In This Case, Gravestone)
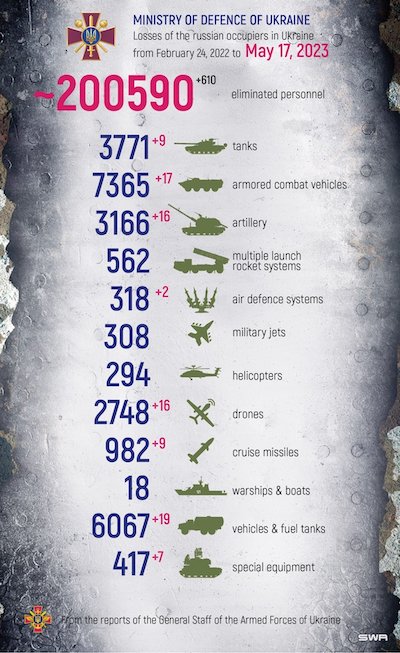
 We’ve been tracking the Ukrainian Ministry of Defence’s tweets about Russian casualties
for 116 days now. [1] [2]
[3] [4]
- The only missing data points are for 2023-Apr-30 and 2023-May-11, so that’s 114 data points with 2 minor gaps.
- We’ve examined the reliability of the data, and come to the conclusion that it’s more conservative than other news media, while less conservative than the OSInt data from Oryx (which requires photo documentation, for example). So it’s not outrageously biased.
- However, the data does come from one of the partisans, so there’s incentive to exaggerate enemy casualties while not reporting their own casualties.
- Finally, the data on some types of casualties, like soldiers killed, have suspiciously good fit to a linear model in time. That could be ok… or not. I can’t really tell.
Still, we’ve been building regression models and checking when they hit 200,000 Russian soldiers dead.
As you can see, that day is today: 2023-May-17 with 200,590 dead.
This is not an occasion for celebration.
It is, however, another grim milestone in a 21st century that none of us like very much.
Who Could Have Predicted That?
Umm… we all could have? And did?
We’ve updated our R script, the Ukrainian MoD images, and the .tsv spreadsheet for all the data through today [5], when the 200k mark was reached.
Let’s think about what the analyses say.
Using all the data
 First, let’s use all the data: from 2023-Jan-22 through 2023-May-17. That’s 116 days,
(though the reality is we have 114 data points since there were no data reported by the
Ukrainian MoD for April 30 and May 11).
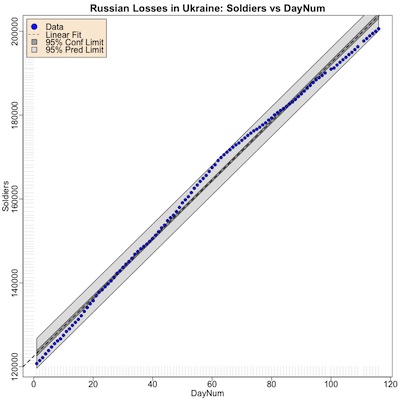
Here’s what the regression looks like.
As you can see, the fit is very good: as shown in the regression report below, it has a very small p-value (below the lowest level R will report), and an adjusted R2∼99.43%. Now, any reasonable person would be very happy with that result and move on.
What do you think: are we going to be reasonable? Have we ever been reasonable?
Residuals:
    Min      1Q  Median      3Q     Max
-3077.9 -1720.8    72.2  1169.4  3299.7

Coefficients:
             Estimate Std. Error t value Pr(>|t|)
(Intercept) 1.225e+05  3.318e+02   369.3   <2e-16 ***
x           6.996e+02  4.984e+00   140.4   <2e-16 ***
---
Signif. codes:  0 ‘***’ 0.001 ‘**’ 0.01 ‘*’ 0.05 ‘.’ 0.1 ‘ ’ 1

Residual standard error: 1767 on 112 degrees of freedom
Multiple R-squared:  0.9943,	Adjusted R-squared:  0.9943
F-statistic: 1.97e+04 on 1 and 112 DF,  p-value: < 2.2e-16
There are 2 problems here:
- This model always predicts a date of 200k sooner than reality. Here it predicts, using
data through today (May 17), that 200k would be reached on May 12 with a 95%
confidence limit of May 7 - 17.
- The cause is easy enough to see: starting on day 60 (2023-Mar-22), the data points bend, to the point where the slope (rate of soldiers killed / day) is lower.
- This means the early points give us a higher slope than is justified by the later data, leading us to estimate 200k day happening earlier. We’ll fix this below.
- The other problem, of course, is that we’re not using causal time series methods. Hence the date, and its 95% confidence interval, can be in the past. This is counterintuitive, and something we can only fix with more sophisticated methods than are really merited by this simple problem. So instead of fixing this, we’ll just keep it in mind and not make predictions in the past.
Using the relevant data
 Now, in general, it’s always a good idea to have large datasets and long baselines. This
is reinforced not just by regression theory, but in general for supervised learning
algorithms via the venerable PAC learning theory.
So it’s only with great fear and trembling we ever truncate a dataset. In this case, it appears that beginning on Day 60 (2023-Mar-22) something happened to lower the casualty rate slightly. So we’re measuring a different process before and after that date! Using all the data means using a lot of irrelevant data, distracting us from what the current data really say.
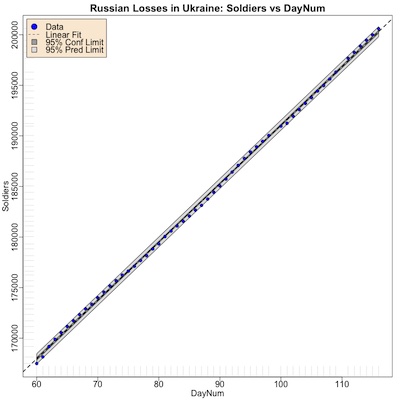
So, ok: we won’t use all the data, just the relevant data since Day 60.
As you can see, both from the plot and from the regression report below, the fit is still excellent, with an even higher adjusted R2 and much narrower confidence bands (dark gray) and prediction bands (light gray).
Residuals:
    Min      1Q  Median      3Q     Max
-475.56 -183.96  -20.29  235.73  333.09

Coefficients:
             Estimate Std. Error t value Pr(>|t|)
(Intercept) 1.333e+05  1.777e+02   750.1   <2e-16 ***
x           5.773e+02  1.999e+00   288.8   <2e-16 ***
---
Signif. codes:  0 ‘***’ 0.001 ‘**’ 0.01 ‘*’ 0.05 ‘.’ 0.1 ‘ ’ 1

Residual standard error: 243.2 on 53 degrees of freedom
Multiple R-squared:  0.9994,	Adjusted R-squared:  0.9994
F-statistic: 8.343e+04 on 1 and 53 DF,  p-value: < 2.2e-16
What’s the result? It’s spot on, of course: 200k dead with a median estimate of today (when we observe it actually happened), and a 95% confidence limit of ±1 day:
         fit        lwr        upr
1 2023-05-17 2023-05-16 2023-05-18
The Weekend Conclusion
- In building supervised learning models (not just regression), it’s important to have large enough datasets that training can converge and have reasonable out-of-sample prediction rates (say, by crossvalidation).
- However, when studying a system with multiple régimes of behavior, it’s important to use either a régime-sensitive model or restrict attention to the most relevant régime for prediction.
- Russian losses in their invasion of Ukraine have been staggering, in all sorts of materiale, but most horrifyingly in the loss of the lives of their own people.
Bottom Line: The Russian human losses are something of a crime against humanity, this time perpetrated against themselves – the worst sort of own goal.
Notes & References
(NB: Regrettably self-referential today. Not a new pattern, we may all hope.)
1: Weekend Editor, “Another Grim Anniversary”, Some Weekend Reading blog, 2023-Mar-02. ↩
2: Weekend Editor, “Do the Ukrainian Reports of Russian Casualties Make Sense?”, Some Weekend Reading blog, 2023-Apr-15. ↩
3: Weekend Editor, “Update: Ukrainian Estimates of Russian Casualties”, Some Weekend Reading blog, 2023-May-01. ↩
4: Weekend Editor, “Updated Update: Ukrainian Estimates of Russian Casualties”, Some Weekend Reading blog, 2023-May-09. ↩
5: Weekend Editor, “Updated3 R script to analyze Ukrainian reports of Russian casualties”, Some Weekend Reading blog, 2023-May-09.
There is also a textual transcript of running this, so you can check that it says what I told you.
We’ve also archived an updated3 .zip file of the original images uploaded by the Ukrainian MoD, and an updated3 .tsv format spreadsheet we constructed from that for analysis.
NB: There are also some subroutine files for graphics and analysis pipeline building
(graphics-tools.r and pipeline-tools.r) that are loaded from our private repository.
If you want those too for reproduction purposes, drop us an email and we’d be happy to send
them along to you.
You might have to rename the script, create a data directory, and put the .tsv file in it with the appropriate name to make this work. Ask if there’s a problem. Here at Château Weekend, we are peer-review-friendly. ↩

Gestae Commentaria
Comments for this post are closed pending repair of the comment system, but the Email/Twitter/Mastodon icons at page-top always work.