Springtime for Shutdowns
Tagged:MathInTheNews
/
Politics
/
R
/
Sadness
/
Statistics
It’s springtime! That means Republicans in the US want to shut down the federal government. Or does it? Let’s look at some data, and find out.
US Government Shutdowns
One of the peculiarities of US government is that it must periodically have its budget passed by Congress and signed by the President. Without this, parts of the government begin to shut down, right up to and including defense, diplomacy, and… everything. [1] All such appropriations bills must, by constitutional fiat, start in the House. [2]
Given a cabal of Republican extremists in the House, such a must-pass bill is an irresistible opportunity for blackmail. They’ll give Ukraine to Russia, default on debt, shut down schools, fail to feed children, cut off pensions for the elderly, block military promotions, or any other way to throw sand in the gears to attempt to force the Republican agenda.
Since they can’t get a majority, blackmail is a perfectly acceptable alternative tool to them. That’s why we’ve had 3 government crises around almost-shutdowns in just the first 3 months of 2024.
Is Republican partisanship fundamentally associated with shutdowns, or not?
Some Data on Shutdown Partisanship
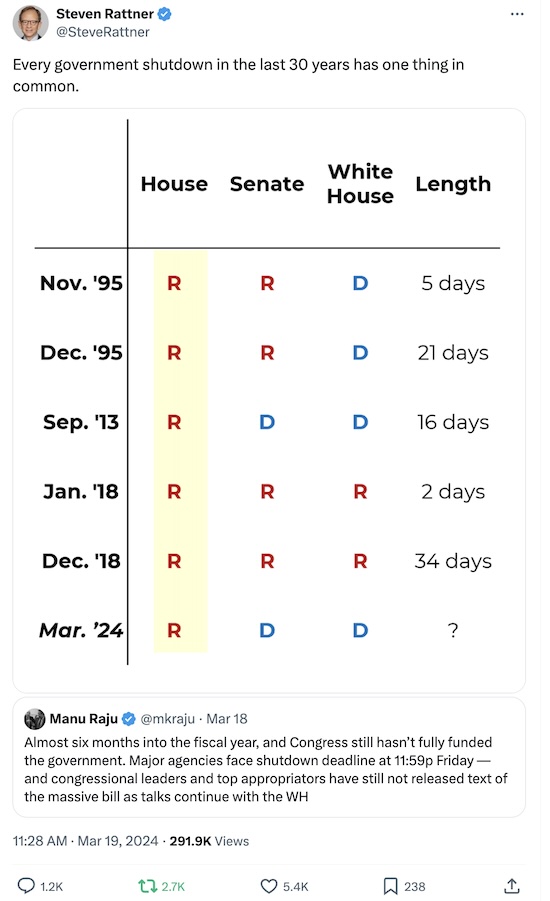
Steven Rattner is apparently an investor, former journalist, former Obama Treasury advisor, and media commentator. He reminded us (on the Bad Social Media Site) of the partisanship associated with the last 30 years of shutdowns. They started to be a regular thing in the 90s, with Republican hysteria over Clinton, and have never left.
The usual rules of engagement for social media apply:
- You probably don’t want to touch X/Twitter.
- Under no circumstances should you read the replies. I looked (briefly), so you don’t have to. They’re mostly along the lines of “fake news”, “lying media”, “shutdowns are good”, and outright denial of the data, as is now traditional among Republicans. (I was alive during this time interval, and can personally confirm the data from direct experience. As if anyone could really doubt it in the first place.)
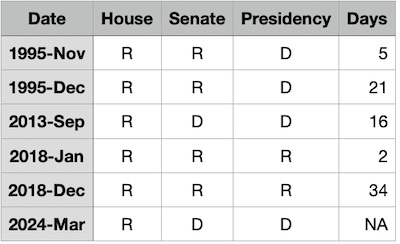 Applied statistician voice: Hey, that’s some data, right there!
We’ve got 30 years of data on the partisanship of each branch of the US government during a shutdown, summarized in a nice neat table, shown here.
Can we make anything of that?
Why, yes. Yes, we can.
And will.
Some Slightly Objective Thinking About the Data
The obvious conclusion being invited here is that shutdowns are associated with Republican dominance, particularly in the House. The House part is understandable, given the constitutional specification. But should we believe the bias here that accuses Republicans of having shutdowns as part of the Republican brand?
There are, as always, 2 questions:
- Statistical Significance: Is the effect real, i.e., will it reproduce in the future?
- Strength of Effect: Is the effect big enough to matter? (If you have great steaming piles of data, you can find statistically significant effects that nonetheless do not matter.)
So, of course we wrote an R script to decide the matter. [3]
Statistical Significance
Naïvely, the data above gives the proportion of the time a given branch is Republican, during each of the 6 shutdowns over the last 30 years:
Let’s start with a Null Hypothesis that the probability of a branch being Republican during a shutdown should be 50% absent anything else happening, i.e., it’s about equal blame for Republicans and Democrats to cause shutdowns. The question of significance is whether the observed probability above is different enough from 50% that we should take notice. Could this have happened by chance in only 6 events, or is it really a thing?
The relevant test here is the
test of proportion.
We did exactly that, using the R
function prop.test()
to test the hypothesis that the observed probability of Republicans presiding over a
shutdown was > 50% (a 1-sided test). Since there were only 6 data points, we also
turned off the Yates continuity correction (though I’m happy to take guidance on that
subject, as well as anything else).
 The results are as shown here.
-
First consider the column .
That’s the raw -value coming out of the test of proportion. It says how likely it is that the proportion of times Republican control a branch could have been > 50% purely by chance. Now, with only 6 shutdowns with which to work, the data has to be pretty extreme to pass the usual significance threshold of .
But, as you can see, the House Republicans are up to the job: is significant: there is only a 0.7% chance of seeing results like this by chance.
The results for the Senate and the Presidency, on the other hand, can be comfortably assigned to chance. Republicans in the House matter, not so much elsewhere.
-
Second, consider the column FDR.
That’s present because we tested 3 hypothesis (Republican dominance in the House, Senate, and Presidency) rather than just 1, using only 1 dataset. Cognoscenti will recognize that we are in (mild) need of a Multiple Hypothesis Test Correction, which accounts for the fact that we’re making just one dataset do triple duty here.
We’ve chosen a very standard Benjamini-Höchberg correction, which corrects a -value into a False Discovery Rate. Basically, if you sort the list of results by increasing FDR (as shown in the table) and then cut it off somewhere, the FDR tells you the fraction of results above the line that are likely to be false discoveries.
As you can see here, if we cut off between House and Senate, there’s an FDR . That’s less than 0.05, so we still pass significance, as there’s only a 2.1% chance we’re accusing House Republicans at random.
Summary:
- The association between shutdowns and Republican control of the House is statistically significant by test of proportion, with and FDR . That is, we’re pretty darn sure there’s a relationship between Republicans controlling the House and a government shutdown.
- There is no similar association with Republican control of the Senate or Presidency. Given the constitutional requirement that funding bills start in the House, this is understandable.
Strength of Effect
Is the effect big enough to matter?
If we had centuries of data, one might argue that by sheer statistical power we’d found something real, but totally small enough to ignore. With only 6 data points, that’s not really a worry: anything significant here has to be whopping big!
However, one thing I learned over years of statistical practice is that people will got to all sorts of lengths to disbelieve a conclusion they don’t like. That includes saying “the effect is real, but small, so I’m going to ignore it.” (In almost exactly those words.)
You really have to hammer down every loose end. So… hammer time.
Here we’re going to use Cohen’s statistic here, which measures a heuristic effect size for proportions. We’re measuring the effect size for the proportion of times the House is Republican during a shutdown (100%) versus the null hypothesis (50%). Cohen’s is computed by:
We used the R function
ES.h() in the
pwr package for this
computation. (We also took the absolute value of the result, as we are only interested in
the size of the effect at this point, not the direction.)
 The results are as shown here.
- On interpreting Cohen’s :
- Cohen’s has a range (in absolute value) from 0 to .
- is a small effect, is a medium effect, and is a large effect.
- As you can see here, the Senate and Presidency have smallish effect sizes, which makes sense as they were statistically insignificant, i.e., probably not real anyway.
- But the effect size for Republican control of the House is , which qualifies the effect size as “honkin’ big”.
Summary: The effect size for Republican control of the House being associated with government shutdowns is enormous.
Bayesian Posterior Beta Approach
Now let’s pretend to be Bayesians for a moment:
-
Every time there’s a shutdown, somebody flips a weighted coin which determines if we’ll see Republicans in charge of the House or not. That’s a Bernoulli Distribution. Just think of it as a heads-or-tails thing, where the probability of heads/Republicans is (same variable as above, sorry):
-
If we then observe shutdowns and ask how many times had Republicans in the House, that’s a Binomial Distribution:
-
Now suppose you observe flips of this coin, of which turn out heads/Republican. What should you believe about , the probability a flip comes up heads/Republican? The simple answer is , though there are elaborations. One elaboration is to consider a Bayesian approach: before seeing any data, we model as a random draw from a uniform prior distribution; after seeing and we should then model as a draw from a Beta distribution of the first kind :
where the normalization is is the complete Beta function.
(It should be pretty clear that the uniform distribution is , i.e., when , which is the case of no observational data. Hence our choice of a uniform prior, since it too is a Beta function.)
If we really need a point estimate of , we can take the median of the posterior Beta distribution. (For technical reasons, there’s a popular method of taking the mode, called Maximum A posteriori Probability, or MAP estimation. We’ll be content with the median here.)
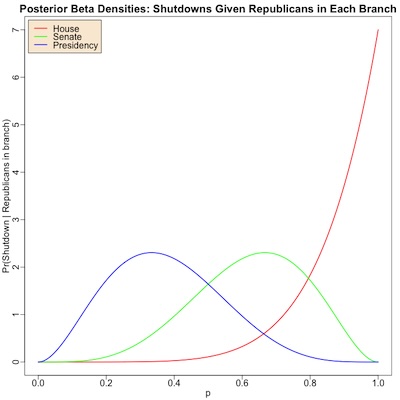
 The resulting distributions for , the probability a branch will be Republican when we
see a shutdown, are shown here.
- As you can see, the curves for the Senate (green, peaks around 2/3, as in 1st equation above) and Presidency (blue, peaks around 1/3, as in 1st equation above) are sort of around the middle value of 50%. That was our null hypothesis, that either party could be at fault. This is just another way of saying that the partisanship of the Senate and the Presidency aren’t especially predictable by shutdowns.
- But the red curve for House partisanship, is clustered up around 100%. This is, of course, because all 6 of the 6 shutdowns in the last 30 years had Republicans in control of the House. It’s a bit less drastic than the point estimate of 100%, but it still is quite damning: when a shutdown happens, it’s a good bet Republicans ruled the House.
The table shows similar information, giving the median values of the distributions for the 3 branches. If you need, for some reason, a single value to quote as the probability a given branch is Republican when you observe a shutdown, this is it. Note that it says observing a shutdown means you should, with more than 90% probability, suspect Republican control of the House.
Summary: The probability of finding Republicans in control of the House when we observe a shutdown is enormous, more than 90%. The Senate and Presidency are, of course, less tainted by Republican mischief.
Another Bayesian Approach to a Slightly Different Question
That was interesting, but it was all centered around estimating . This tells us, when we inevitably experience a government shutdown, what to expect to observe in the House.
We might well be interested in the Bayesian conjugate, i.e., . That is, if we stupidly elect Republicans to the House again, what’s the chance they’ll cause another shutdown?
This is addressable with a direct application of Bayes Theorem:
Ok, let’s estimate that, over the last 30 years when shutdowns have become a more regular thing. This goes back to the Gingrich speakership. One might argue it should go back to the Reagan presidency, when Republican madness became more pathological. But as we’ve seen, the House is the pressure point for shutdowns, and Gingrich was when the infection spread to the House.
For the last 30 years (1994-2024), there have been 15 congressional terms: 11 Republican and 4 Democratic. So .
Over those 15 congressional terms, there have been 6 shutdowns (assuming one is about to happen now). So .
Thus:
Summary: Should you be rash enough to vote for a Republican House candidate, you are abetting a 54.5% probability of a government shutdown during that Congressional term.
Don’t do that.
The Weekend Conclusion
Springtime. Not, apparently, just for the return of plants and wildlife any more. Now it’s apparently for the return of fascism.
Mel Brooks, in his comic genius illustrated here from The Producers (1967, 2005), did not foresee that we would be this stupid to let fascists blackmail us about whether the US government is even allowed to operate.
Look: our US problem with shutdowns and debt defaults is a real problem. The evidence unequivocally points at Republicans, particularly in the House, as the root of the problem. Do not vote Republican, not ever, not for any imaginable office, not under any conceivable circumstance. And at least for the next election, also do not vote 3rd party or abstain from voting: that’s half a vote for fascism & Trump.
You really must vote for Biden and for Democrats in both houses of Congress.
(Ceterum censeo, Trump incarcerandam esse.)
Addendum 2024-Mar-23: Averted, For Now?
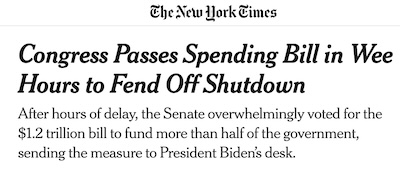 According to the NYT [4], the House managed to pass a
budget 286 (101R + 185D) to 134, and then immediately adjourn for 2 weeks. Note that only
a minority of Republicans voted for this, relying on Democrats to do the work for them.
This left the Senate with the obligation to meet at night on an emergency basis, and either pass the House budget with no changes (since the House was now gone for 2 weeks), or sink the government. It passed the Senate 74 to 24, i.e., 24 Senate Republicans would rather sink the government. It took almost 12 hours in the Senate to get even that much agreement, since the nihilist faction was so determined to load it up with poison pills.
This is also, as far as I know, the only time a budget has been passed this late: 6 months into the fiscal year.
Technically, there was a shutdown: at midnight, the OMB began a shutdown, but stopped a few hours after midnight when the Senate passed the budget at 2am. So technically the US government was dead for a few hours, but was resuscitated in the middle of the night.
In reaction, Rep Marjorie Taylor Greene (R-GA) began filing the motions to oust her own party’s speaker. Basically:
- They wanted a border control bill.
- Then they refused to pass the most conservative border control bill in a generation.
- Then, because there was no border bill, they wanted to defund all of government.
- Then, because the funding bill squeaked by, they want to oust their own Speaker. Apparently they can show how much they hate government by destroying their own governmental appointees.
No, it doesn’t make sense. Don’t even try to make sense of it; you might hurt yourself.
These are the dangerously stupid people we have to remove systematically from every elected office.
Addendum 2024-Apr-02: A Bayesian Coda
We’ve added a post showing the posterior Beta distribution for the probability of shutdown when each party controls the House.
Notes & References
1: Wikipedia Editors, “Government shutdowns in the United States”, Wikipedia.org, retrieved 2024-Mar-21. ↩
2: Wikipedia Editors, “Appropriations bill (United States)”, Wikipedia.org, retrieved 2024-Mar-21. ↩
3: Weekend Editor, “R script to assess significance and strength of Republican association with US government shutdowns”, Some Weekend Reading blog, 2024-Mar-21. There is also a transcript of running this, for you to check that it says what we say it says.↩
4: C Edmondson, “Congress Passes Spending Bill in Wee Hours to Fend Off Shutdown”, New York Times, 2024-Mar-22. ↩

Gestae Commentaria
Comments for this post are closed pending repair of the comment system, but the Email/Twitter/Mastodon icons at page-top always work.