Are the Pfizer vaccine's efficacy confidence intervals sensible?
Tagged:COVID
/
MathInTheNews
/
PharmaAndBiotech
/
R
/
Statistics
Somebody asked me about the confidence intervals Pfizer reported for vaccine efficacy in various age groups. Some of them are negative! Are they sensible?
What’s the question, again?
Ok, nobody actually asked me this one. Or maybe I asked myself. I was reading, as is the custom of the people of my tribe, Miles Kimball’s blog, Confessions of a Supply-Side Liberal. [1] Miles pointed to an article by Gary Cornell [2], an apparently semi-retired mathematician who blogs about a mathematician’s eye view of the pandemic. So… sort of kindred souls there, I think.
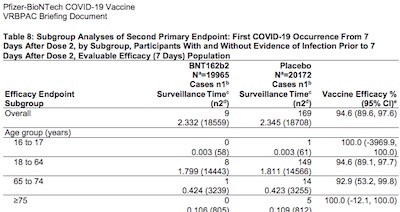
Now, Gary looked at the FDA re-analysis of the Pfizer data [3], which is what we looked at here a couple days ago, among other things. But unlike your humble Weekend Editor who just picked out the pretty survival plot, Gary actually dug through the tables. Of particular interest is Table 8 on page 26, which gives the subject counts and the vaccine efficacy, and the 95% confidence interval on the efficacy, across various age groups (q.v.).
Apparently Gary wants to know 2 things:
- Do we know if it works in various age groups, particularly in the elderly whose compromised immune systems make them harder to vaccinate?
- How certain are we about that?
What’s a confidence interval?
I applaud this, particularly the last part. As a statistician, or even just a responsibly-behaving scientist, you should never just give people a simple number for whatever quantity is of interest, despite their fervent desire to say “just gimme the number!” Instead, you should also give them some measure of uncertainty: ideally a probability distribution peaked around the simple number, but also a confidence interval will do nicely.
So what’s that?
Pfizer reported an overall vaccine efficacy (see table, q.v.) of 94.6%, with a 95% confidence interval of 89.6% – 97.6%. That means, we’re 95% sure that the true value is somewhere in the interval [89.6, 97.6]. But if you have to have a single number for some Philistine reason or other, then the best single estimate is 94.6%. See how that works? We report a single best estimate (94.6%) and a confidence interval (89.6% – 97.6%) and a confidence level (95%). That way, we get the single number people want, but we get a measure of uncertainty: we’re 95% certain it’s somewhere in this interval, and here’s your best single bet (typically a median or mode of a Bayesian posterior distribution).
There are about a bajillion ways of computing a confidence interval and its point estimate. Those methods are argued about furiously by statisticians. But as a consumer of statistics, you mostly just want to know that you have you a confidence interval, and then check that it’s reasonably narrow. For example, if I say the vaccine efficacy is 83% with a confidence interval of 1% – 99%, then a look at that huge confidence interval tells you the 83% point estimate is worthless: it could be almost anything!
So the second of Gary’s questions can be addressed by looking at the Pfizer vaccine efficacy confidence intervals, and seeing if they inspire confidence. (Answer: both yes and no.)
Pfizer vaccine effiacy & confidence interval, by age cohorts
 So here’s the relevant extract from Table 8 of the FDA’s reanalysis.
- The first column is an age group (16-17, 18-64, 65-75, and 75+).
- The second column tells us the number of infections and the number of subjects total in the treatment arm. (And something about surveillance time which is important in a more sophisticated analysis, but we’re not being that sophisticated here.)
- The third column tells us the same thing, for the control group.
- The fourth column tells us the vaccine efficacy and its 95% confidence interval, computed in a way that wasn’t exactly spelled out. (The footnote says it’s the Clopper-Pearson method for binomial proportion confidence intervals, with no further detail.)
- Note that the bottom 4 rows don’t quite add up patient counts to reproduce the Overall counts in the first row, due to some gnarly patient selection criteria I haven’t tried to wrap my brain around.
So Pfizer is reporting an overall efficacy of 94.6%, with a confidence interval of 89.6% – 97.6%. That’s a nicely tight confidence interval, i.e., we’re pretty sure the efficacy is quite high. We’re in fact 97.5% sure that it’s above 89.6%, so basically the lower confidence limit is kind of like a worst likely case. If that’s high (as it is here), you can be happy about the result.
But look at some of the other age groups:
- For 65-74 year olds, like your humble Weekend Editor, the confidence interval is 53.2% to 99.8%! That is, it could be anything above 50%, more or less. That is… less than completely inspiring of confidence.
- Even more so, look at the 75+ age group and the 16-17 year olds: the lower confidence limit is negative, which when you think about it makes no sense at all. Basically, the numerical method they used to estimate the confidence interval wasn’t prepared to deal with low sample counts and we should just say the lower limit is 0%, i.e., no efficacy whatsoever.
Ok, that leads us to ask some questions:
- Why is the confidence interval so wide in some age groups?
- How is efficacy defined here, anyway?
- How can a confidence interval be computed in a way that (mostly) doesn’t give absurd negative results?
The first question is easy: there are too few subjects in the 16-17 year old group and in the 75+ year old group! This illuminates why at the VRBPAC meeting, some of the members voted against approval for 16-17 year olds: the data just isn’t there.
Defining vaccine efficacy
The efficacy is computed (apparently; I’m reverse engineering here!) as follows. First, define the probability of infection, conditional on the arm of the trial:
\[\begin{align} p_{\mathrm{trt}} & = \Pr(\mbox{infection} | \mbox{treatment}) \\ p_{\mathrm{cnt}} & = \Pr(\mbox{infection} | \mbox{control}) \end{align}\]You might do a point estimate for those based on the number of infections in the arm divided by the total number of subjects in the arm, for example. (But we can do better; see below.)
The the efficacy in percent is:
\[\begin{align}\label{eq:efficacydefn} \mbox{efficacy} = 100.0 * (1 - \frac{p_\mathrm{trt}}{p_{\mathrm{cnt}}}) \end{align}\]If we try that, we reproduce the Pfizer table above pretty well:
Age groups, patient counts, and point estimates of efficacy:
  Subgroup  Ntrt Ntrtinf  Ncnt Ncntinf    VE
1  Overall 18559       9 18708     169  94.6
2    16-17    58       0    61       1 100.0
3    18-64 14443       8 14566     149  94.6
4    65-74  3239       1  3255      14  92.8
5    >= 75   805       0   812       5 100.0
There’s a teensy difference of 0.1% in row 4, the 65-74 year olds, where we get 92.8% while Pfizer reported 92.9%. I hope that’s because they’re using a more sophisticated method, or maybe they have some patient exlusion criteria not obvious in the report. But basically, we’ve reproduced their estimates of efficacy from the patient counts, or close enough.
Confidence intervals
Now, what about the confidence intervals? And why are Pfizer’s sometimes mysteriously negative at the lower confidence limit?
Let’s deal with the second question first. The footnote says they’re using the Clopper-Pearson method for binomial confidence intervals, which is more-or-less frequentist method that is reasonably well known (by people who know this sort of thing, at least). However, note that the places where their lower confidence limit goes negative are exactly where the count of infections goes to 0. People who really know Clopper-Pearson (see previous link) know that there’s a special-case exact form to be used in that case, instead of the slightly approximate case used otherwise. That would have given a lower limit of 0%, i.e., no efficacy.
Ok, no real problem statistially; it just says that for the very young and the very old, we do not have evidence of efficacy. That’s not a statistical problem, but it sure is a problem!
A Bayesian approach to estimating the probability of infection in each arm
Can we do any better?
Without access to the detailed dataset, probably not: this is a type of problem called a “survival problem” best dealt with by Kaplan-Meier estimates, Cox regression, and the like. We don’t have the data for that.
But can we do some rough estimates that might be a bit better? Maybe!
Let’s use the following notation:
\[\begin{align*} N_{\mathrm{trt}} & = \mbox{# patients in treatment arm} \\ N_{\mathrm{trtinf}} & = \mbox{# patients in treatment arm who got infected} \\ p_{\mathrm{trtinf}} & = \Pr(\mbox{infected} | \mbox{treatment arm}) \\ \\ N_{\mathrm{cnt}} & = \mbox{# patients in control arm} \\ N_{\mathrm{cntinf}} & = \mbox{# patients in control arm who got infected} \\ p_{\mathrm{cntinf}} & = \Pr(\mbox{infected} | \mbox{control arm}) \end{align*}\]Then, as we’ve done several times now, we can assume a uniform (Beta distribution $B(1, 1)$) prior on $p_{\mathrm{trtinf}}$ and $p_{\mathrm{cntinf}}$, which leads to Beta posteriors:
\[\begin{align} \label{eq:posteriorBeta} \Pr(p_{\mathrm{trtinf}} | \mbox{trt}) & \sim \mathrm{Beta}(N_{\mathrm{trtinf}} + 1, N_{\mathrm{trt}} - N_{\mathrm{trtinf}} + 1) \\ \label{eq:posteriorBeta2} \Pr(p_{\mathrm{cntinf}} | \mbox{cnt}) & \sim \mathrm{Beta}(N_{\mathrm{cntinf}} + 1, N_{\mathrm{cnt}} - N_{\mathrm{cntinf}} + 1) \end{align}\] Let’s look at those posterior betas, as we did before with more approximate data, and see
how what we believe about infection probability differs between treament & control
arms.
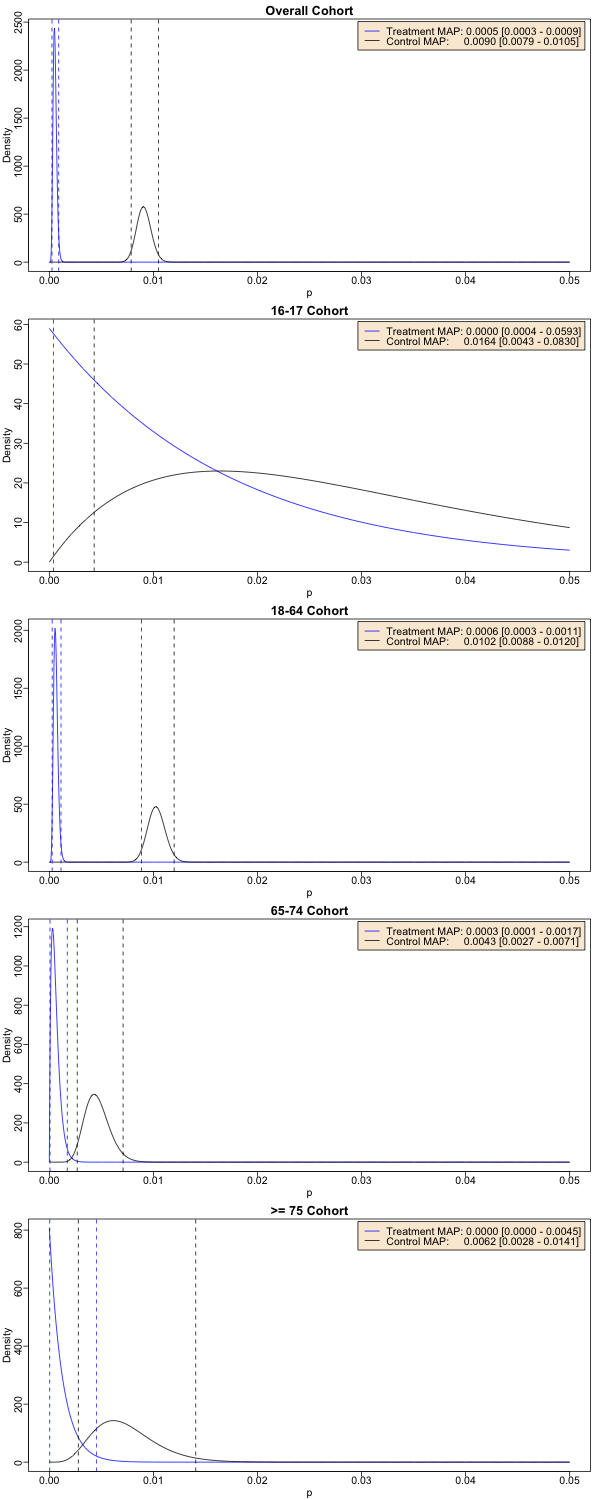
There’s 1 plot here for each age cohort. The blue curve is the treatment arm, and the black curve is the control arm. The vertical dashed lines are the 95% confidence limits on the probability of infection in each arm; we’d like to see those well separated.
Going down the plots:
- The overall cohort shows good separation. Our distribution for the probability of infection in the treatment arm (blue) is well lower than the control arm (black). Even the 95% confidence limits are separated. This is a good result.
- The 16-17 year old cohort is hopeless. The upper confidence limits are off-scale to the right! We have no evidence to conclude an effect here, not even close!
- The 18-64 cohort looks (unsurprisingly) like the overall cohort: good separation between treatment and control.
- The 65-74 cohort is a little more worrisome: the distributions are separated, and the 95% confidence limits don’t overlap… but barely. This is a weak result.
- The 75+ cohort shows overlap of the 95% confidence limits. It’s not as terrible as the 16-17 year olds, but we also have no evidence to suppose an effect here (though almost!).
But what about efficacies?
Ok, so we’ve modeled the probability of infection in the treatment and control arms with Bayesian posterior Beta distributions. What about efficacies? If you look at equation $\eqref{eq:efficacydefn}$, our definition of efficacy, you see that it takes the ratio of those 2 probabilities. That means our notion of efficacy is now a random varible, which has whatever distribution we get from a ratio of 2 Beta-distributed random variables.
Gotta admit, I’ve never encountered that before. But the problem of ratio distributions in general is pretty gnarly, often leading to fat-tailed monsters. For example, the ratio of 2 normally distributed variables is often a Cauchy-distributed variable: tails so fat the standard deviation isn’t even defined, and hence the Central Limit Theorem does not apply, and… well, all your base are belong to us, or something like that.
The integral looked less than completely amusing, so I did a literature search to see of some other poor schmuck had to do it first (always a good research technique). And it turns out this has all been worked out by Pham-Gia [4]… but the paper is paywalled and costs $51 to read! I suppose I could write to him and ask for a copy of this 20-year-old paper, but that’s too annoying.
Then it turned out that Saffer also had this problem, got hold of the Pham-Gia paper somehow, and wrote some software in a GitHub repository. [5] But… the quoted result is rather complex, invovling both Beta functions and hypergeometric functions:
![]()
…and as I believe I’ve mentioned before, your humble Weekend Editor is still working through some childhood trauma around hypergeometric functions like ${}_{2}F_{1}()$. So… not gonna go there either.
We’ll do it numerically: start with equations $\eqref{eq:efficacydefn}$ and $\eqref{eq:posteriorBeta}$ – $\eqref{eq:posteriorBeta2}$. Draw many random samples from the appropriate pair of Beta distributions, and thus compute samples of the ratio. Then determine the quantiles numerically.
Here’s the result:
  Subgroup  Ntrt Ntrtinf  Ncnt Ncntinf    VE   2.5%  50% 97.5%
1  Overall 18559       9 18708     169  94.6   89.7 94.2  97.2
2    16-17    58       0    61       1 100.0 -393.7 57.0  98.7
3    18-64 14443       8 14566     149  94.6   89.0 94.3  97.3
4    65-74  3239       1  3255      14  92.8   58.3 88.6  98.3
5    >= 75   805       0   812       5 100.0    8.3 87.1  99.6
- We’ve made at least 1 improvement: the lower confidence limit on the 75+ cohort is no longer negative! Also, given how the posterior Beta distributions overlapped for that cohort, we’ve been more pessimistic about the efficacy. So, that’s good.
- On the other hand, we still get a negtive lower confidence limit for the 16-17 year old cohort. This is because we resorted to numerical estimation instead of the analytic solution, and it breaks down when the number of cases is 0 and the total number of subjects is very small. That’s the same problem Pfizer had, though ours is slightly less outrageously hugely negative.
- As for the rest, we confirm the tight confidence limits on the overall cohort and the 18-64 cohort; we also confirm the disturbingly loose confidence limits on the 65-74 cohort.
So Pfizer did ok. They didn’t use the methods I would have (and even I should use the analytic solution of Pham-Gia and Saffer to avoid the stupid negative LCL for the 16-17 cohort). But we generally agree: overall good result, good result in 18-64, marginal result in 65-74, no evidence of efficacy in 75+, and the 16-17 cohort is a joke that should have been removed.
So what does that mean?
Some of our results:
- We’ve reproduced, at least approximately, Pfizer’s point estimates of efficacy in each age cohort.
- Initially, they all look good. But when we consider the 95% confidence intervals, Pfizer’s own table tells us there is no reason to claim efficacy in 16-17 year olds, and in 75+ year olds. We confirmed this with a Bayesian posterior Beta distribution analysis, and a numerical estimation of the confidence limits on the efficacy.
- This explains why some of the VRBPAC committee members balked at endorsing the vaccine for 16-17 year olds. They probably would not balk at 75+ year olds, since they desperately need a vaccine and have little other recourse.
The R script for this analysis is downloadable here [6], because here at Chez Weekend we believe in peer review.
Notes & References
1: Disclosure: once upon a time, a long time ago, when Miles were nought but a wee undergrad, I knew him slightly through our religious community. I knew his older brother slightly more, but… yeah, I kind of liked him back in the day. He’s matured well, and that’s why I read his blog. ↩
2: G Cornell, “Statistics in the Pfizer Data – how good do they show the vaccine to be?”↩, Gary Cornell’s Blog, 2020-Dec-09.
3: FDA staff, “FDA Briefing Document: Pfizer-BioNTech COVID-19 Vaccine”, FDA.gov, retrieved 2020-Dec-12. ↩
4: T Pham-Gia, “Distributions of the ratios of independent beta variables and applications”, Comm Stat: Theory & Methods, 29:12, 2693-2715. DOI: 10.1080/03610920008832632 ↩
5: J Saffer, “Beta Quotient Distribution”, GitHub Repository, retrieved 2020-Dec-12. ↩
6: Weekend Editor, Pfizer vaccine efficacy confidence interval script in R, Some Weekend Reading, 2020-Dec-12. ↩

Gestae Commentaria
Comments for this post are closed pending repair of the comment system, but the Email/Twitter/Mastodon icons at page-top always work.