Pfizer/BioNTech vaccine interim readout: 90% efficacy!
Tagged:COVID
/
MathInTheNews
/
PharmaAndBiotech
/
R
/
Statistics
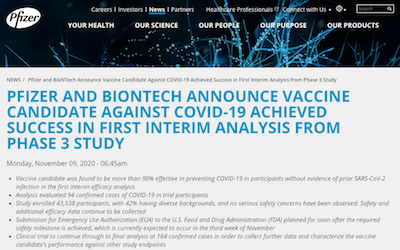
Today the Pfizer/BioNTech vaccine trial gave its first interim readout: 90% efficacy. This is unabashedly good news.
 This is an interim readout from Pfizer & BioNTech [reference 1],
meaning it’s an early look at the data using simplified analyses. And it’s just a press
release: a bit of corporate propaganda to which your Weekend Editor has allergies, instead
of peer-reviewed science. But still… 90% efficacy is very good news, indeed!
I’m very slightly surprised that Moderna wasn’t the first to do an interim readout, since they looked slightly ahead. But, a lot of this sort of thing is down to random chance, so that doesn’t mean much. What is meaningful: all the vaccines target the same spike protein, and what’s more Moderna and Pfizer both target it with an mRNA vaccine. So, if one vaccine works, they’re all likely to work (to varying degrees, in varying populations, but that’s a good thing).
And… mRNA vaccines will have been proven to work. That’s another good thing, since they can be developed very quickly.
Cautionary notes
- Being an interim readout, there is a chance that the final results will weaken the result.
- We’re talking about a study with $N = 38,955$ participants who have received both doses, and we’ve thus far seen only 94 COVID cases in both treatment & control arms, total. That is a very small fraction of the total (about 0.2%)!
- The initial study design called for an interim readout at 32 cases, and while the FDA was negotiating a protocol amendment to increase that to 62 cases, the number of cases climbed up to 94. We really have let political dysfunction lead into uncontrolled spread.
- The final readout will be at 164 cases, and that is expected to happen sometime in late November. The bad news is uncontrolled spread; the good news is that makes it easy to run the trial and get a fast readout. That’s a bad trade-off, but here we are.
- Protection looks like it will last at least a year. Possibly longer, but even so, it’s acceptable to get an annual booster shot until the virus is stamped out of human circulation.
- Strangely, Pence tried to claim today that the Trump administrations Operation Warp Speed helped. Pfizer was quick to deny that they were ever part of that, nor had they ever taken money from the Trump administration for this. So, at least that got slapped down quickly.
- The required safety data is not yet in hand. We want to see at least 2 months of safety data, for at least half the participants. Even that is ok for a smallish population to be vaccinated, but thin ice if you’re going to vaccinate billions. After all, if you have a billion patients, then one-in-a-million events are going to crop up about 1,000 times.
- The vaccine requires an onerous cold chain of -70°C freezers. That’s going to be hideously difficult in most of the world, where you take the vaccine out of the -70°C freezer, dry ice pack it, and from that moment you’re on a short timeline with the clock ticking away the minutes until you get it into a patient. I have literally no idea how that can work in the developing world; even in the US, Europe, and Japan it’s difficult to imagine working outside the big cities.
- Doses are limited. It won’t be available to average citizens until maybe mid next year, optimistically? And then it takes at least a month to get both doses and get the immunity built up after the second dose. So… isolation is the rule of the day for at least 8 more months.
But hey, remember the good news
At least we have preliminary evidence that it’s possible to make a coronavirus vaccine.
I won’t go into the details here. You can read the Pfizer/BioNTech press release in reference 1, or you can read Derek Lowe’s excellent summary in reference 2.
Added 2020-Nov-10, because I just can’t leave this alone:
Hey, it’s good news, and this is 2020, right? I can’t just walk away from this. As
astute readers may recall, we solved a similar problem in
the post about the racial balance of the Boston Police Department,
so we can just repurpose that machinery. Let’s use the following notation:
\(\begin{align*}
N & = \mbox{# patients in trial w/2nd dose} & = 38955 \\
NT & = \mbox{# patients in treatment arm} & = N/2 \\
NP & = \mbox{# patients in placebo arm} & = N/2 \\
K & = \mbox{# infections seen in both arms} & = 94 \\
KT & = \mbox{# infections in treatment arm} & \mbox{} \\
KP & = \mbox{# infections in placebo arm} & \mbox{}
\end{align*}\)
Then, by conservation of patients and the 90% efficacy claim, we know that:
\(\begin{align*}
KT + KP & = K \\
KT / KP & = 0.10
\end{align*}\)
Solve those 2 equations for $KT$ and $KP$:
\(\begin{align*}
KP & = K / 1.1 & = 85.45455 \\
KT & = K - KP & = 8.545455
\end{align*}\)
Now we can make the crosstabulation matrix in R:
> N  <- 38955
> NT <- N / 2
> NP <- N / 2
> K  <- 94
> KP <- K / 1.1
> KT <- K - KP

> mx <- matrix(c(NT - KP, KP, NT - KT, KT), nrow = 2, byrow = TRUE, dimnames = list(c("Placebo", "Treatment"), c("Uninfected", "Infected"))); mx
          Uninfected  Infected
Placebo     19392.05 85.454545
Treatment   19468.95  8.545455
Applying Fisher’s exact test, possibly while tasting tea, we get the result that the treatment & control arms are very statistically significantly different, i.e., the vaccine seems to be working:
> fisher.test(mx)
	Fisher's Exact Test for Count Data

data:  mx
p-value < 2.2e-16
alternative hypothesis: true odds ratio is not equal to 1
95 percent confidence interval:
 0.04661974 0.20988610
sample estimates:
odds ratio
 0.1054685
The similar (slightly old-fashioned, but still serviceable) test of proportion confirms that result:
> prop.test(mx)
	2-sample test for equality of proportions with continuity correction

data:  mx
X-squared = 61.448, df = 1, p-value = 4.546e-15
alternative hypothesis: two.sided
95 percent confidence interval:
 -0.004973602 -0.002923622
sample estimates:
   prop 1    prop 2
0.9956127 0.9995613
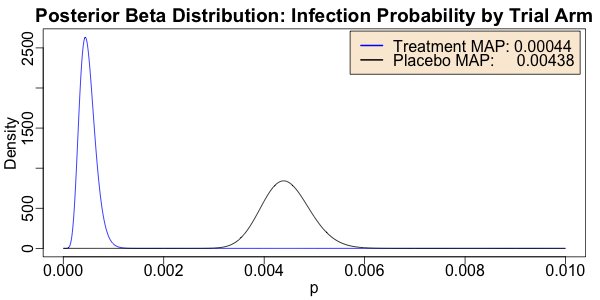
If we think like a Bayesian for a moment, we realize that each arm took a bunch of people, did something to them, and then measured the probability per unit time, $p$, of getting infected in each group. We can start from a prior uniform distribution for $p$, where we assume we know nothing at all about the likely value of $p$: $\Pr(p) \sim \mbox{Uniform}(0, 1)$. Then the Bayesian posterior distributions are Beta distributions:
\[\begin{align*} & \Pr(pP | \mbox{placebo}) & \sim \mathrm{Beta}(KP + 1, NP - KP + 1) \\ & \Pr(pT | \mbox{treatment}) & \sim \mathrm{Beta}(KT + 1, NT - KT + 1) \end{align*}\]We can compute values for each of those distributions, and get a MAP estimator (“maximum a posteriori probability”, here basically the mode of the posterior Beta distribution), and see if the two distributions are visually distinct when plotted as the above tests hint they should be.
> ps  <- seq(from = 0.0, to = 0.01, length.out = 1000)
> pPs <- dbeta(ps, shape1 = KP + 1, shape2 = NP - KP + 1)
> pTs <- dbeta(ps, shape1 = KT + 1, shape2 = NT - KT + 1)

> source("~/Documents/laboratory/tools/graphics-tools.r")

> withPNG("./images/2020-11-09-vaccine-efficacy-data.png", 600, 300, FALSE, function() { withPars(function() { matplot(ps, matrix(c(pTs, pPs), byrow = FALSE, ncol = 2), type = "l", lty = "solid", col = c("blue", "black"), xlab = "p", ylab = "Density", main = "Posterior Beta Distribution: Infection Probability by Trial Arm"); legend("topright", inset = 0.01, bg = "antiquewhite", legend = c(sprintf("Treatment MAP: %.5f", ps[which.max(pTs)]), sprintf("Placebo MAP:     %.5f", ps[which.max(pPs)])), col = c("blue", "black"), lty = "solid", lwd = 2) }, pty = "m", bg = "transparent", ps = 16, mar = c(3, 3, 2, 1), mgp = c(1.7, 0.5, 0)) })
 Here we see that the distributions are indeed quite distinct; the equiprobability point is
way out in the tails of both. The MAP estimators of the probability of infection per time
(here we’re rashly assuming all patients are in the trial for the same time which is
wrong, but not horribly so) differ by about a factor of 10: 0.4% vs 0.04% (per whatever
time interval it is between now and the average enrollment date).
Why That’s All Wrong
These methods, of course, are wrong! The statistically principled way to do this is using something called a Cox proportional hazard model, a Kaplan Meier plot, and a logrank $p$-value. The official analysis submitted to the FDA will certainly do that. But for now, the press release doesn’t report enough information to do those kinds of analyses (and if it did, the media would immediately garble it). So we are forced to use more dubious methods, in adherence to long-held tradition:
“If people aren’t given well-founded methods …, they’ll just use dubious ones instead.” — Jonathan Tawn, professor of statistics at Lancaster University & medalist of the Royal Statistical Society, on extreme value theory
So while this is wrong, it’s not great-whacking-stupid wrong. It does indeed confirm that even with just a few infections observed so far, the vaccine seems to work. It’s highly likely that the Moderna vaccine, which is also an mRNA vaccine against the same viral spike protein, will also work. It’s pretty likely that the other vaccines, using different technology, will also work.
And it’s dead certain that we’re going to have a sea change in the vaccine industry, moving to more mRNA vaccines in the future. That’s even more good news.
Added 2020-Nov-11
There’s a nice Bayesian view of this result at Economics and R, reposted on R-bloggers, specifically see [reference 3] and from Fells Stats [reference 4] (written by someone who took the trouble to dig through the actual clinical trial protocol document, which earns my respect; they find the point estimate is more like 97% for a variety of technical reasons).
Added 2020-Nov-12
Zvi, over at Less Wrong, wrote a nice summary of another sort [reference 5].
Notes & References
1: Pfizer & BioNTech, “Pfizer and Biontech announce vaccine candidate against COVID-19 achieved success in first interim analysis from Phase 3 study”, Pfizer.com press releases, 2020-Nov-09.↩
2: D Lowe, “Vaccine Efficacy Data!”, In the Pipeline blog at SciTranslMed, 2020-Nov-09.↩
3: Economics and R, “A look at the Biontech/Pfizer’s Bayesian analysis of their Covid-19 vaccine trial”, reposted in R-bloggers.↩
4: Fells Stats, “The Pfizer-Biontech Vaccine May Be A Lot More Effective Than You Think”, reposted in R-bloggers.↩
5: Zvi, “Covid 11/12: The Winds of Winter”, Less Wrong, 2020-Nov-12 (reposted from Don’t Worry About the Vase.↩

Gestae Commentaria
Comments for this post are closed pending repair of the comment system, but the Email/Twitter/Mastodon icons at page-top always work.