Is the racial makeup of the Boston Police Department unrepresentative?
Tagged:MathInTheNews
/
Politics
/
R
/
SomebodyAskedMe
/
Statistics
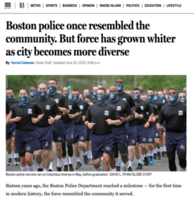
Somebody asked me about this article in the Boston Globe by Vernal Coleman on the racial makeup of the Boston Police Department: does it resemble the community it polices?
These days, police are understandably under intense scrutiny. So… scrutinemus!
Story
 Reporters love story, i.e., they will move heaven and earth to uncover a narrative with
people telling you how things felt. Rarely do they have any such feelings about data, let
alone math, which is entered begrudgingly as lesser evidence. But we nerds see it the
other way around, so… does the evidence back up the story, or not?
Let’s get the “story” out of the way:
It turns out that in 1973 Black officers were only 2% of the department vs 20% of the city – you don’t need a fancy statistician to tell you that ain’t right! (Though a fancy statistician did in fact just tell you that.) One thing led to another; federal case, lawyers, judges, consent decree, blah, blah blah: and the deparment was legally forced to hire one minority officer for every white officer it hired, until they became balanced. (This is the sort of thing that puzzles me. I want to ask them: “This is so obviously sensible, why did you need literally a federal case to force you to do it?!”)
And what do you know? It worked! In 2004, “for the first time in modern history” the BPD looked like the community. So the judge lifted the order.
Can you guess the rest? What does the story require, dramatically, for the reporter to notice?
The accusation is, of course, that the BPD went back to its bad old ways and became whiter. And to service the needs of the narrative, there are quotes in the article from veteran minority officers who say this is indeed their personal experience. Good for them; we should listen to them.
Ok, enough story.
Data
 Do the data give us any guidance as to what to think about that story? So here’s what we know:
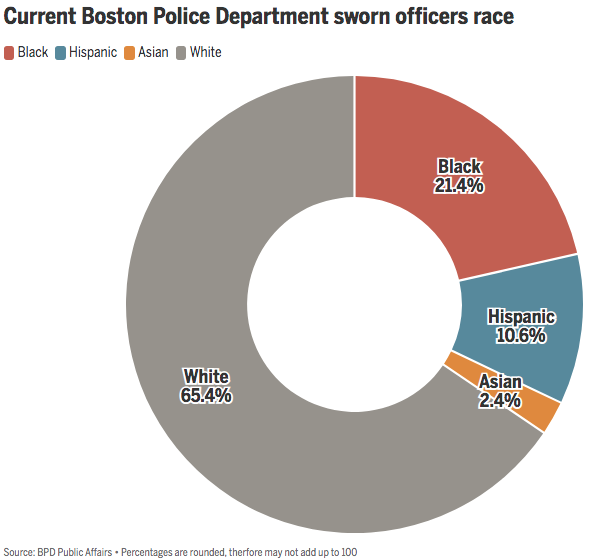
- The venerable Globe’s chart tells us the current BPD officers are 65.4% white.
- Wikipedia on the BPD tells us they have 2015 officers.
- The census data on Boston tells us city has 692,600 residents, of whom 52.6% are white.
So our research question is: is 65.4% of BPD being white significantly different from 52.6% of Bostonians being white?
The first thing we do is build a contingency table (we’re using R here, of course), showing the number of white/nonwhite people in the BPD and in Boston generally:
> mx <- matrix(c(2015 * 0.654, 2015 * (1 - 0.654), 692600 * 0.526, 692600 * (1 - 0.526)), nrow = 2, byrow = TRUE, dimnames = list(c("BPD", "BOS"), c("White", "Nonwhite"))); mx
        White  Nonwhite
BPD   1317.81    697.19
BOS 364307.60 328292.40
Analysis
Fisher’s exact test (devised, according to legend, for the problem of The Lady Tasting Tea) is sort of the canonical way to ask if the row & column proportions in a contingency table are really different. A small p-value means there’s very little chance the differences are random, and that the effect is real. Here the p ~ 2.2e-16, so it’s very significant:
> fisher.test(mx)
	Fisher's Exact Test for Count Data

data:  mx
p-value < 2.2e-16
alternative hypothesis: true odds ratio is not equal to 1
95 percent confidence interval:
 1.553230 1.870766
sample estimates:
odds ratio
   1.70401
Another way to test this is using a test of proportion. It tests just what we want to know: whether getting 65.4% of the BPD is really different from getting 52.6% of Boston (i.e., the null hypothesis is that the proportions are the same and any variation is just sampling noise). Here again, a tiny p-value (in fact the smallest R will report, which is why it’s the same as for the Fisher exact test) tells us the effect is real:
> prop.test(mx)
	2-sample test for equality of proportions with continuity correction

data:  mx
X-squared = 131.53, df = 1, p-value < 2.2e-16
alternative hypothesis: two.sided
95 percent confidence interval:
 0.1069478 0.1490522
sample estimates:
prop 1 prop 2
 0.654  0.526
Finally, we can think like a Bayesian, at least for a minute. What we’ve measured experimentally here are really just some conditional probabilities: p1 = Pr(White | BOS) and p2 = Pr(White | BPD). But both p1 and p2 have some distribution: if we start with a uniform prior, then the posterior here is a Beta distribution. We can plot those distributions, and see if our uncertainty about the 2 probabilities (the “proportions”) has them well-separated or not:
> source("~/Documents/laboratory/tools/graphics-tools.r")
> ps <- seq(from = 0, to = 1, length.out = 1000)
> bpd <- dbeta(ps, shape1 = 1318, shape2 = 698)
> bos <- dbeta(ps, shape1 = 364308, shape2 = 328293)
> withPNG("../images/2020-07-03-bpd-racial-makeup-posterior-beta.png", 600, 300, FALSE, function() { withPars(function() { matplot(ps, matrix(c(bpd, bos), byrow = FALSE, ncol = 2), type = "l", lty = "solid", col = c("blue", "black"), xlab = "p", ylab = "Density", main = "Bayesian Posterior Beta Distributions"); legend("topright", inset = 0.01, bg = "antiquewhite", legend = c("BPD", "BOS"), col = c("blue", "black"), lty = "solid", lwd = 2) }, pty = "m", bg = "transparent", ps = 16, mar = c(3, 3, 2, 1), mgp = c(1.7, 0.5, 0)) })
 As you might expect, with 692,600 people, we are very certain about the distribution for
Boston in general. With the BPD 300x smaller than the population of Boston, we have
considerably more uncertainty. But the Boston spike is the tall black one, while the BPD
is the smaller, more spread-out blue one. Yes, there’s some uncertainty… but we’re not
in the least uncertain that these 2 distributions are different. The BPD is indeed
whiter than Boston.
Conclusions
Case closed? Not really. We’ve just demonstrated to our satisfaction that there really is a difference here. We’ve demonstrated statistical significance, i.e., that the story is telling us something real. So at least a conversation about racial makeup of the police force is firmly grounded in reality.
We have not demonstrated strength of effect, i.e., that the real difference in racial makeup has big consequences in terms of policing policy. (It probably does, but that’s just my story, not a fact.)
We need to have investigative reporting and honest political discussions about what we value in police practices, what outcomes we are seeking, and whether those outcomes are best addressed via police at all (as opposed to public health, employment, housing, and education for example). That will take time and good will, both in regrettably short supply. Perhaps then we can devise a police force that is finally clearly under civilian control, and operating for the common good.

Gestae Commentaria
Comments for this post are closed pending repair of the comment system, but the Email/Twitter/Mastodon icons at page-top always work.