On the Base Rate Fallacy, Redux
Tagged:COVID
/
MathInTheNews
/
PharmaAndBiotech
/
Sadness
/
SomebodyAskedMe
/
Statistics
Will we ever not be trapped by the base rate fallacy?
The base rate fallacy
 There’s this fallacy, a common bug in the way people think, called the base rate
fallacy. [1]
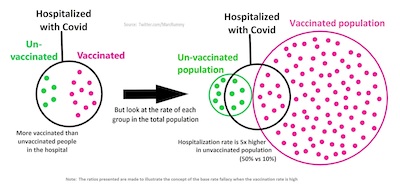
Consider Wikipedia’s illustrative example:
- If you just look in the black circle on the left, you would conclude more of the hospitalized people were vaccinated than unvaccinated. Naïve observers conclude, incorrectly, that vaccines don’t work.
- But if you consider the base rates, i.e., the fraction of people vaccinated versus unvaccinated as shown on the right, you see that many more people are vaccinated in the first place. In fact, a far smaller fraction of the vaccinated end up hospitalized than the unvaccinated. A less naïve observer concludes, correctly, that vaccines do, indeed, work.
The general case is that when you measure some differential property (hospitalization), it’s important to consider the base rate, or how often the classes of examples occur in the population (more vaccinated than unvaccinated).
Alas, to me that’s mostly word salad. (As with many things.) Fortunately, there’s a Bayesian way to look at this:
- Let H = hospitalization, V = vaccination, and ∼V = no vaccination.
- Naïve observers look only in the hospital, not in the population, and sees
the probability of being vaccinated or not given they’re in the hospital.
- That is, they see Pr and conclude vaccination does not work.
- Less naïve observers note that they want to see the Bayesian reverse. That’s the
probability of being hospitalized, given vaccination status:
\left\{ \begin{align*} \Pr(H \vert V) &= \frac{\Pr(V \vert H) \Pr(H) }{ \Pr(V) } \\ \Pr(H \vert \sim V) &= \frac{\Pr(\sim V \vert H) \Pr(H) }{ \Pr(\sim V) } \end{align*} \right.- In these 2 equations, \Pr(H) is the same in both cases, because the number of people hospitalized is just whatever it is, independent of vaccination.
- The denominators, \Pr(V) and \Pr(\sim V) are the base rates: the probability that an individual chosen at random from the population is vaccinated or not.
It’s that normalization by the base rate that makes all the difference! It transforms the thing you can observe (what percent of hospitalized people are vaccinated) into the thing you want to know (what percent of vaccinated people are hospitalized). The former is observable, but nonsensical input to policy. The latter is the only thing that matters.
(See the Addendum below for the particulars of the Wikipedia example pictured above.)
Previously, on some crummy little blog that nobody reads…
Now, most NTs are gonna see those equations and say “oh, just another nerd thing I can skip”… again. I mean, it was just some Wikipedia example, right?
Well… previously on this CLBTNR, we documented real-life examples of this, in terms of Simpson’s paradox [3], the base rate fallacy, and Bayesian thinking in COVID-19 hospitalization data in mid-2021.
There we worked through the real-life example presented by the Israeli hospitalization data. In a population that’s about 20% unvaccinated versus about 80% vaccinated, it would be astounding if most of the hospitalized people weren’t vaccinated. That’s because there are 4x as many vaccinated as unvaccinated. It turned out that the vaccinated were a bit more than 3x less likely to be hospitalized than the unvaccinated, which is what mattered!
So if you want to see actual combat usage of these ideas, the blog post linked above will walk you through the process using Israel hospitalization data as of mid-2021.
If you want to conclude something about vaccine efficacy, you have to do the Bayesian calculation above. (And stratify by age groups, with confidence intervals, as we also showed in that same blog post.)
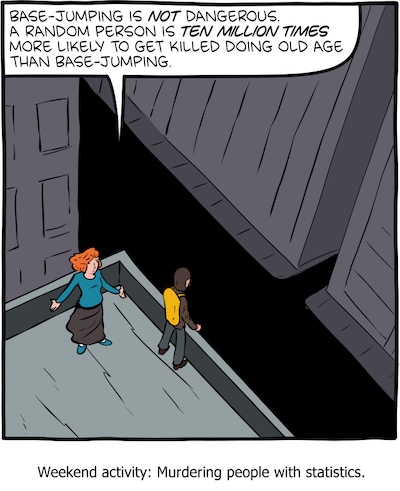
SMBC really gets it
 The always-excellent web cartoon Saturday Morning Breakfast Cereal (SMBC) by Zach
Weinersmith is on the case. He illustrates the base rate fallacy via the example of base
jumping [2], where it allows you to assert base jumping is
perfectly safe because more people die of old age than base jumping!
Of course this is nonsense: almost all the people dying of old age were not base jumpers, and some large-ish fraction of those who were base jumpers died of base jumping, not old age!
If you ignore the base rates, you conclude incorrectly that base jumping is perfectly safe, in fact safer than living to a ripe old age.
There is a technical term for this sort of thing: “fatal nonsense”.
You probably want to avoid it.
The Weekend Conclusion
Look, even the cartoonists get it nowadays. (Albeit an excellent cartoonist.)
Isn’t it time we all “got it”, too?
(If you find all this confusing, Gary Cornell wrote an explainer for general audiences, about a year and a half ago, published in Slate. [4] Recommended.)
Addendum 2023-Feb-16: Wikipedia example, math details
Somebody asked me to work through the details of the Wikipedia example pictured above. Ok, sure, let’s do that.
First step is just to count the dots:
- The number of unvaccinated people (green dots) is N_{\sim V} = 10.
- The number of unvaccinated people who are also hospitalized (green dots inside black circle) is N_{\sim VH} = 5.
- The number of vaccinated people (red dots) is N_{V} = 100.
- The number of vaccinated people who are also hospitalized (red dots inside black circle) is N_{VH} = 10.
The conditional probabilities about which our putative naïve observer is making such
a fuss are:
\left\{
\begin{align*}
\Pr(V \vert H) &= \frac{10}{5 + 10} = \frac{2}{3} \sim 66.7\% \\
\Pr(\sim V \vert H) &= \frac{5}{5 + 10} = \frac{1}{3} \sim 33.3\%
\end{align*}
\right.
It looks (to the naïve) as though vaccinated are twice as likely to be hospitalized?! Let’s do better than that blunder!
The overall probabilities of being hospitalized and the probability of being vaccinated
are:
\left\{
\begin{align*}
\Pr(H) &= \frac{5 + 10}{10 + 100} = \frac{15}{110} = \frac{3}{22} \sim 13.6\% \\
\Pr(V) &= \frac{100}{10 + 100} = \frac{100}{110} = \frac{10}{11} \sim 90.9\%
\end{align*}
\right.
Now let’s work out the conditional probability of being hospitalized given vaccinated, and
hospitalized given unvaccinated:
\left\{
\begin{align*}
\Pr(H \vert V) &= \frac{\Pr(V \vert H) \Pr(H)}{\Pr(V)} = \frac{(2/3) (3/22)}{(10/11)} = \frac{1}{10} = 10\% \\
\Pr(H \vert \sim V) &= \frac{\Pr(\sim V \vert H ) \Pr(H)}{\Pr(\sim V)} = \frac{(1/3) (3/22)}{(1/11)} = \frac{1}{2} = 50\%
\end{align*}
\right.
We can verify this directly, using our counts of dots:
\left\{
\begin{align*}
\Pr(H \vert V) &= \frac{N_{VH}}{N_V} = \frac{10}{100} = 10\% \\
\Pr(H \vert \sim V) &= \frac{N_{\sim VH}}{N_{\sim V}} = \frac{5}{10} = 50\%
\end{align*}
\right.
The right of it, finally: vaccinated are 5x less likely to be hospitalized (10% vs 50%)!
Moral: Leaping to public policy choices from ignorantly measuring the wrong thing is a very bad idea. Here, it would have led to exactly the opposite policy for saving lives.
Notes & References
1: Wikipedia contributors, “Base rate fallacy”, Wikipedia, retrieved 2023-Feb-14.↩
2: Z Weinersmith, “Weekend activity: Murdering people with statistics”, Saturday Morning Breakfast Cereal, 2022-Dec-24. ↩
3: Wikipedia contributors, “Simpson’s paradox”, Wikipedia, retrieved 2023-Feb-14.↩
4: G Cornell, “What Does It Really Mean When a Headline Says ‘75 Percent of Cases Occurred in Vaccinated People’?”, Slate, 2021-Aug-04. ↩

Gestae Commentaria
Comments for this post are closed pending repair of the comment system, but the Email/Twitter/Mastodon icons at page-top always work.