Is COVID-19 Omicron/BA.4-5 the Most Infectious Viral Disease in Human History?
Tagged:CatBlogging
/
COVID
/
JournalClub
/
MathInTheNews
/
Politics
/
SomebodyAskedMe
/
Statistics
Somebody asked me about how seriously we should take the COVID-19 Omicron/BA.4-5 variants, given that so many people are “done with COVID” and refuse to mask. Response: basically, we should take it very seriously; people without masks are being very silly. Silly in a deadly fashion, irresponsible to the health of the rest of us. To answer the titular question: yes, unfortunately, it appears so.
But isn’t COVID-19 mostly over?
In a word: no.
One might be excused for thinking it’s over, given the wildly incompetent media reports, the corporate pressure for “business as usual”, the glacial government reaction times, and the social conformity pressure to pretend so by doffing masks. (Hey, the Asch conformity experiments are a Real Thing!) For example, many news sources consult the CDC’s COVID Data tracker [1], which is normally a very good source indeed.
But… for inscrutable reasons, it by default reports the most sunny view of the data, and buries the darker and more forward-looking view under a drop-down menu.
Let’s have a look and see what it says.
The default view (the current snapshot): community level
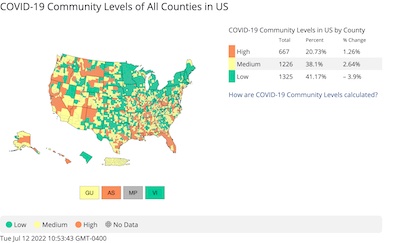
 If you just naïvely open the CDC COVID Data Tracker and ask for all US data at the
county level, you get by default the reassuring map shown here. There’s all that lovely,
calming green in here in the fastness of New England, so here at Château Weekend we
always like to see that. Sure, Florida’s a disaster, but they shoot themselves in the feet
with great regularity, so no surprise there. The conservative red states of the south and
west are somewhat similar. California’s a bit surprising to me, but perhaps not to people
who keep up with this sort of thing.
Generally speaking, this says community levels are currently manageable. It’s an over-interpretation to say “COVID is over”, but you can see how overly excitable people might look at this map and conclude that.
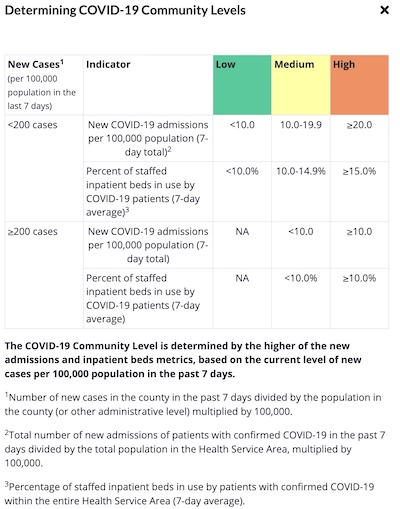
But what do they mean by “community level” of COVID-19? The explainer box tells us. It’s the higher of 2 measures: hospital admissions or inpatient beds of those already hospitalized, per 100,000 population over the trailing 7 days. There are separate thresholds for calling low/medium/high depending on whether there are more or less than 200 cases.
While one can argue endlessly over the details of whether or not this measures what you care about, one thing is clear: it is a snapshot of current hospital loads over 1 week in time. It is not a forward-looking measure that can give you an idea of what’s to come!
The forward-looking view: community transmission
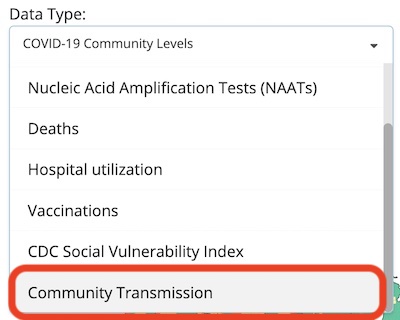
There are other metrics one might prefer, to get a more forward-looking picture. To their credit, the CDC does provide those. To their discredit, they are not the default, and are in fact buried in a drop-down that must be scrolled down to the bottom to find them! That’s the situation highlighted here: click on the “Data Type” drop-down, scroll all the way to the bottom to find “Community Transmission” (which I’ve circled in red), or how COVID-19 is currently growing in the US at the county level of granularity.
Current community levels tell you about what’s happening right now; community transmission levels tell you where things are going. It’s just bizarre to me that this is not the default, and that the default is a measure so misleadingly sunny in its outlook.
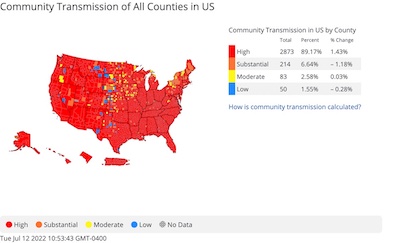
The community transmission level is quite grim: almost everywhere in US territory is now high.
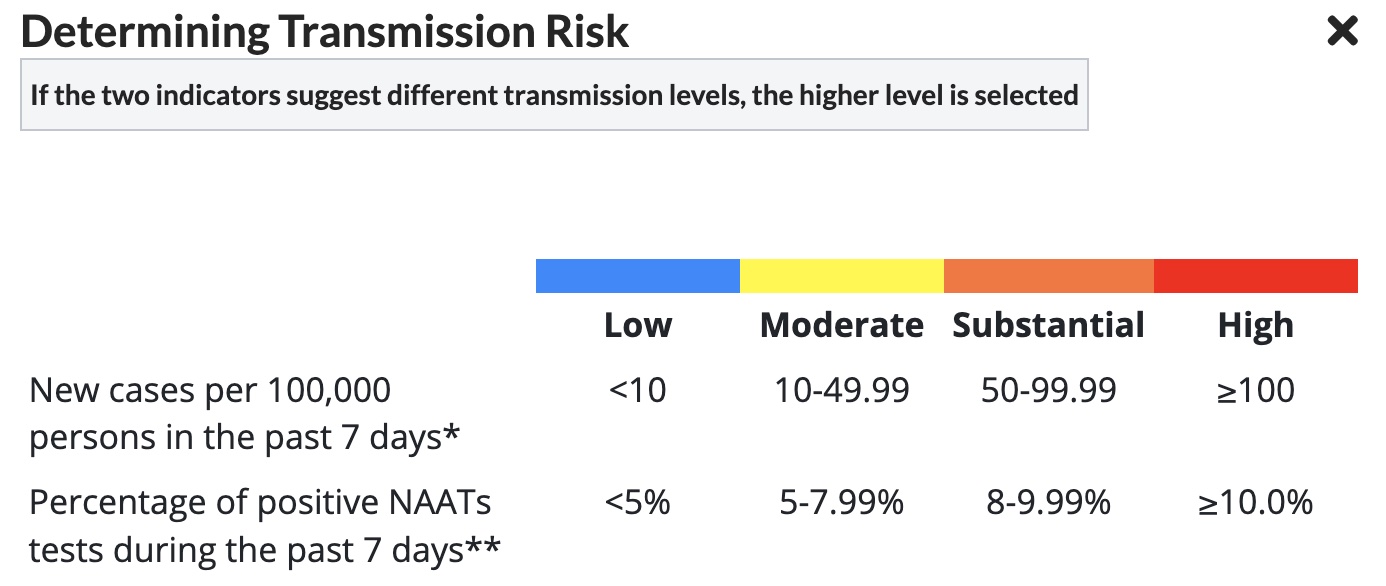
Another bonus point is that the definition of community transmission level is simpler than the above rules for community levels, i.e., just a combination of per capita case rates and positive test rates. (And the positive test rates are woefully underestimated, since most people don’t report home tests. The real numbers are likely much worse.)
This looks to me like another wave is forming up. Feel free to call me on this in a couple of months if I’m wrong! (If it turns out I’m right, then never mind. This Crummy Little Blog That Nobody Reads (CLBTNR) is firmly enmired in Cassandra Syndrome: often correct, never believed.)
What about COVID-19 Omicron/BA.4-5 transmission?

 So it looks like there’s a lot of COVID-19 being passed around. Is that due to the
Omicron variants, specifically the BA.4 and BA.5 subvariants, or is it something else?
I came across an article by Esterman in The Guardian [2] on this topic. Understandably he’s mostly focused on Australia, but we all know by now that pandemics are global in nature, and you can’t hide simply by being on the opposite side of the world. (Ok, maybe New Zealand or Tonga, if you’re an island nation willing to seal your borders completely, even to your own citizens.)
It was also signal-boosted at Sibylla Bostoniensis [3], by Siderea in her role as “freelance psychopomp” to the “Greater-Boston Weirdo-American community”. (I wish I could make up titles that cool!)
Here’s Esterman’s key paragraph (emphasis added):
How transmissible are BA.4/5?
We measure how contagious a disease is by the basic reproduction number (R0). This is the average number of people an initial case infects in a population with no immunity (from vaccines or previous infection).
New mutations give the virus an advantage if they can increase transmissibility:
- the original Wuhan strain has an R0 of 3.3
- Delta has an R0 of 5.1
- Omicron BA.1 has an R0 of 9.5
- BA.2, which is the dominant subvariant in Australia at the moment, is 1.4 times more transmissible than BA.1, and so has an R0 of about 13.3
- a pre-print publication from South Africa suggests BA.4/5 has a growth advantage over BA.2 similar to the growth advantage of BA.2 over BA.1. That would give it an R0 of 18.6.
This is similar to measles, which was until now was our most infectious viral disease.
R0∼18.6?! That’s… eye-popping. We better check out his references to make sure that’s what they really say. Also, this seems like a good place to collect those references in one big bag, so we have an easy source to which to refer people.
So let’s check each of those 6 points emboldened above:
- Original Wuhan variant: The source cited here is from an Australian public health agency [4], though since it’s only the appendix we can’t really see who the authors are or the main thrust of the report. It seems to have been written at a time when Australia was moving from Delta- to Omicron-dominance. Page 2 confirms the numbers Esterman cited in his first 3 claims: ancestral R0∼3.28, Delta R0∼5.08, Omicron/BA.1 R0∼9.5.
- Delta variant: The source cited is a paper by Liu & Rocklöv [5], which estimates Delta R0. It is a meta-analysis of 5 other studies, finding a range of 3.2 – 8, with a mean of 5.08. So that successfully documents Esterman second claim.
- Omicron/BA.1: The source cited is a follow-up paper by Liu & Rocklöv [6] about 6 months later. This is another meta-analysis of 5 other studies, separately estimating R0 and Re. About halfway down Table 1 is the punchline: Omicron/BA.1 R0∼9.5. Confirmed again.
- Omicron/BA.2: Here we have a bit of an ambiguity. The source cited is a
paper in Nature Signal Transduction & Targeted Therapy by Fan,
et al. [7] They don’t quite state that R0∼13.3, but they do say:
- Delta R0∼3.2−8 with a mean of 5.08, from the work above by Liu & Rocklöv
- Omicron (presumably BA.1?) is approximately 3.2x more transmissible than Delta
- Omicron/BA.2 is approximately 1.4x more transmissible than Omicron/BA.1
However, you can’t just multiply 5.08×3.2×1.4 to get an R0 for Omicron/BA.2 from Delta. (The transmissibility numbers refer to transmission rates among household contacts.) Now, I haven’t scrutinized every single sentence in this paper, but I read through it quickly and couldn’t find any explicit claim that Omicron/BA.2 R0∼13.3. Esterman might have taken the Omicron/BA.2 R0 and just multiplied by 1.4: 9.5×1.4=13.3, which is what he claimed.
- Omicron/BA.4-5: The sources cited here are a South African preprint on BA.4-5 [8] and a Nature news explainer on the subject by Ewen Callaway. [9] Neither of them quote an R0∼18.6, or, for that matter, any other value. The closest I can get is the statement that “… BA.5 had a daily growth advantage of … 0.12 (95% CI 0.09 - 0.15) … relative to BA.2”. It’s not especially obvious how Esterman got to the very specific reproduction number of 18.6.
- Measles: The measles comparison cites a meta-analysis by FM Guerra, et al. [10] It is unfortunately behind an execrable paywall, but their abstract declares they found significantly more variation than the usually cited R0∼12−18. So again, no precise quantitative confirmation.
Summary:
- Claims 1-3 are solidly verified as occurring in explicit form in the scientific literature.
- Claims 4-6 appear to be a result of fiddling around with multiplying “more transmissible” numbers by previous versions of R0.
The Weekend Conclusion
We can’t sign off on full agreement with Esterman at the quantitative level. However, we can agree with him on a qualitative basis, i.e., R0 for Omicron/BA.5 is hella huge, whatever the particular value on which we converge.
 It may or may not be as bad as measles, which is so far the most contagious viral disease
known. But it’s surely very bad.
Alas, it’s hard to wake people up to this reality. Most of my acquaintances, even here in liberal New England, are hypnotically transfixed by the “end of COVID-19”, and keep telling those of us wearing masks we can take them off. As you can see from the evidence above, nothing of the sort is the case: community transmission levels are high, and Omicron/BA.5 appears to be a contender for the worst viral disease of all time, with a good chance to take the title from measles.
I tried to explain this to the Weekend Publisher. But as you can see here, he’s like my acquaintances: too busy napping to pay attention.
His excuse is that he’s just a cat. What’s everybody else’s excuse?
Notes & References
1: US CDC Staff, “COVID Data Tracker”, US Centers for Disease Control & Prevention, downloaded 2022-Jul-12. ↩
2: A Esterman, “New Covid subvariants BA.4 and BA.5 are the most contagious yet – and driving Australia’s third Omicron wave”, The Guardian, 2022-Jul-04. ↩
3: Siderea, “R0 18.6”, Sibylla Bostoniensis, 2022-Jun-11. ↩
4: Unnamed Australian health agency staff, “COVID-19 CDNA National Guidelines for Public Health Units, Appendix A - Current variants of concern”, early 2022, retrieved 2022-Jul-12. ↩
5: Y Liu & J Rocklöv, “The reproductive number of the Delta variant of SARS-CoV-2 is far higher compared to the ancestral SARS-CoV-2 virus”, J Travl Med 28:7, 2021-Oct-11, taab124. DOI: 10.1093/jtm/taab124.. ↩
6: Y Liu & J Rocklöv, “The effective reproductive number of the Omicron variant of SARS-CoV-2 is several times relative to Delta”, J Travel Med 29:3, 2022-Mar-09, taac037. DOI: 10.1093/jtm/taac037. ↩
7: Y Fan, et al., “SARS-CoV-2 Omicron variant: recent progress and future perspectives”, Nature Sig Transd & Targ Ther 7:141, 2022-Apr-13. DOI: 10.1038/s41392-022-00997-x. ↩
8: H Tegally, et al., “Continued Emergence and Evolution of Omicron in South Africa: New BA.4 and BA.5 lineages”, preprint at medRχiv, 2022-May-02. DOI: 10.1101/2022.05.01.22274406. ↩
9: E Callaway, “What Omicron’s BA.4 and BA.5 variants mean for the pandemic”, Nature 606, 848-849 (news explainer), 2022-Jun-23. ↩
10: FM Guerra, et al., “The basic reproduction number (R0) of measles: a systematic review”, The Lancet Infectious Diseases 17:12, e420-e428, 2017-Dec-01. DOI: 10.1016/S1473-3099(17)30307-9. ↩
Gestae Commentaria
Gack!
Yep. Pretty much sums it up.