L'état du blog: 2021
Tagged:About
/
R
/
Statistics
/
TheDivineMadness
/
ϜΤΦ
A full calendar year of blogging has passed. So, thankfully, has the annus horribilis 2021CE. How did we come out? (The blog, that is. 2021 itself is still too traumatizing to discuss.)
When the geeks count time by the kalends
Fiat blog was on 2020-Jul-01, my first day of retirement. Just now, my first full year of retirement blogging ended on 2021-Dec-31.
According to the TimeAndDate.com duration calculator, 549 days have elapsed total, 365 of which were in calendar 2021 proper. So we’ve been writing this crummy little blog that nobody reads for almost exactly a year and a half:
549 days365.24 days/yr=1.503 yrThe year-end is a time for retrospection and introspection. And since it’s the sesqui-blogiversary, let’s see how things have gone. For that purpose, I’ve written a little R script to analyze post/comment/hit statistics and test for trends over time, the relationship between comments and hit counts, etc. [1] (Excluding this post itself, of course, for obvious reasons!)
The results of this script are available in the Notes & References below for:
- Calendar year 2020 (6 months starting 2020-Jul-01) [2]
- Calendar year 2021 (all 12 months) [3]
- All years combined (18 months) [4]
Conclusion: Calculemus!
Frequencies of posts, comments, and hits
So first let’s use the script’s output (saved in spreadsheets in the Notes & References) to get an idea of how many posts and comments there were in 2020 and 2021, and some idea of the average rate. The script has this built in already, so from the transcript we can extract this nifty little table:
| Year | NPosts | NDays | NComments | Days/Post | Days/Comment | |||||
|---|---|---|---|---|---|---|---|---|---|---|
| 2020 | 41 | 184 | 21 | 4.49 | 8.76 | |||||
| 2021 | 111 | 365 | 58 | 3.29 | 6.29 | |||||
| Total | 152 | 549 | 79 | 3.61 | 6.95 |
- Recall that we started blogging in mid-2020, so only half the days of 2020 are available. So the Null Hypothesis is: twice as much activity in 2021 compared to 2020.
- That being said, we have more than twice as many posts in 2021, so the posting rate has gone up a little bit.
- The comments have gone up triple instead of just double, so there’s a real increase there. (Though starting from a low base, so it’s gone from “negligible” to “very low”.)
- It looks like we were posting just a tad over twice a week (every 3.29 days), a slightly higher rate than last year. Our goal was once a week, so that’s more or less ok.
- The comment rate went up also, now about 1ce/week. However, since I reply to most comments, the rate of comments from actual readers is still a lowish value of 1 comment about every 2 weeks.
- The number of comments per post is remarkably steady, albeit dismally low:
- 2020 saw 21/41 = 0.51 comments per post
- 2021 saw 58/111 = 0.52 comments per post
- Overall, that’s 79/152 = 0.52 comments per post.
Conclusion: This is still a blog you can keep up with by reading once a week. Also, for some mysterious reason I get more comments via email than the comment system.
Hits and comments in relation to time
That’s been mostly about writing posts. What about reading?
To investigate readership, we’ll next look at the post hits vs time (regrettably including my own looking at the posts searching for errors and things to rephrase), and comments vs time.
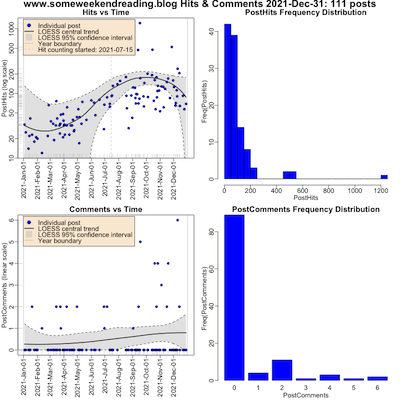 Here’s the hits vs time and comments vs time for 2021 (click to embiggen). The 4 plots
are:
- Top left: Hits vs time. The horizontal axis is time; the vertical axis is the number of hits on a log scale. Each blue point is a post. The black curve is the LOESS curve (sort of like a local curve fit); the gray band is the 95% confidence interval on the LOESS curve. The vertical dashed line is when hit tracking was turned on; hits before this date represent people looking through the back catalog of posts.
- Top right: Histogram of hit counts. This gives you an idea of the probability distribution of hits.
- Lower left: Comments vs time. The horizontal axis is time; the vertical axis is number of comments (linear scale). Each blue point is a post. The LOESS curves are as previously explained.
- Lower right: Histogram of comment counts. This gives you an idea of the probability distribution of comments per post.
The conclusions seem pretty clear:
- Hits increased dramatically in Q2, when I started leaving comments on other blogs.
- The increase is dominated by 5 outliers, all of which were live-blogging FDA hearings on COVID-19 vaccines and drugs.
- The trend since then has been to relax downward, but above where it was at the beginning of the year.
- Most posts get under 100 hits. There is a smallish group with 100-200 hits, and the rest are a few outliers.
- Comments are rare! Most posts get none, and everything else is an outlier.
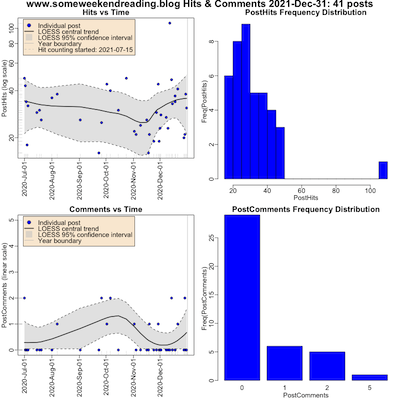 For comparison, here’s the same analysis restricted to 2020 only (just the 2nd half of the
year; click to embiggen).
For 2020, we see that hits just bumbled along steadily, generally under 40 hits/post. Comments were also quite rare.
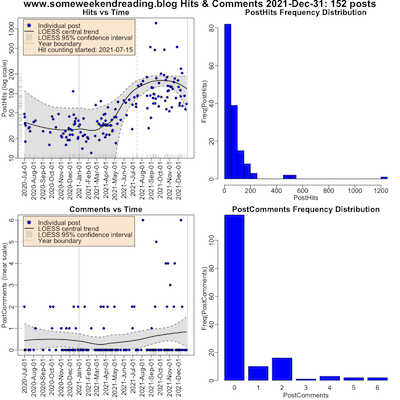 And finally there’s the omnibus dataset, looking at all data from the blog’s Big Bang through
today (click to embiggen).
This shows the same sort of conclusions, just more firmly stated with more data:
- In 2020, the hit rate was around 30 hits/post; after 2021 Q2 the rate went above 100 hits/post; accounting for the 5 high outliers indicates a background rate of maybe 50 hits/post.
- Comments are still rare. The rising LOESS curve for comments would be encouraging, except that nearly all the probability mass is on the horizontal axis at 0 comments.
Conclusion: Still a crummy little blog that nobody reads, unless I write about an FDA hearing for medications against life-threatening pandemic diseases, and advertise that fact in the comments section of a high-traffic blog.
Are there more comments on high-hit posts?
As long as we’re thinking about comments, we might want to entertain the hypothesis that there are more comments on posts with more hits. After all, hits are people looking; the more people who look the greater the cumulative chance that somebody will comment, right?
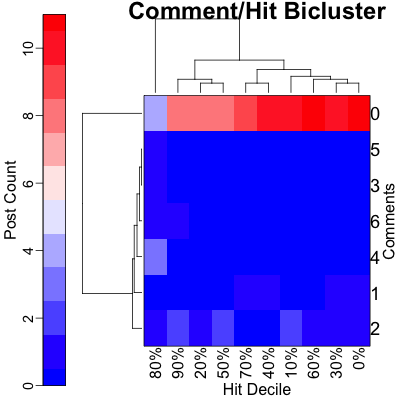
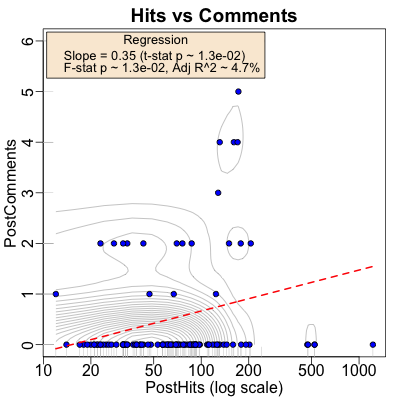 To investigate such a relationship in 2021, we’ll first do an exploratory bicluster of comment
counts vs hit counts (top figure), and then a linear-log regression of comments on log
hits.
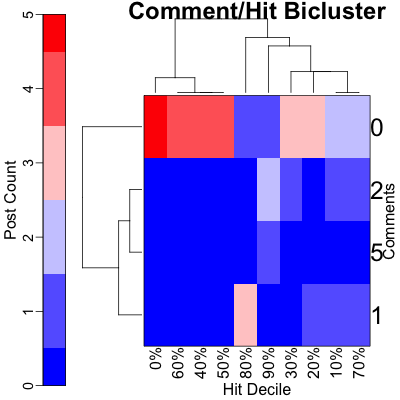
- The bicluster is shown on top:
- The color shows the number of posts with a given number of hits and number of comments.
- The rows are just the number of comments.
- The hits have been reduced to a rank, i.e., a decile. This is to take care of outliers, i.e., the one post that got O(1200) hits. (This plays the same role as the log transform in the regression, q.v. They are shown in the columns.)
- The row and column dendrograms permute the rows and permute the columns until the ones that most resemble each other are adjacent. The length of a leg of the dendrogram indicates the statistical significance of the split.
- Hit dendrogam: Basically, there’s one outlier column at the 80%-ile in hits but which has 0 comments. The rest of the columns are more or less the same; maybe a higher and lower hit group, but at very much less significance. This is not great evidence for a hit/comment relationship!
- Comment dendrogram: Here the story is brutally clear: the 0-comment row stands out with most of the posts, and any number of hits above 0 makes them all look almost identical.
- We conclude that the 0-comment posts stand apart, and there is weak to no evidence of more hits leading to more comments.
- The linear-log regression is shown on the bottom:
- Each post is a blue dot.
- The horizontal axis is the number of hits, on a log scale. The rug on the horizontal axis gives you some idea of the (log) density of hits.
- The vertical axis is the number of comments for each post. The rug on the vertical axis is uninformative, as there are only 7 levels.
- The gray curves gives you an idea of the joint density (from kernel density estimation by convolution with a gaussian of appropriate bandwidth). It definitely says most of the probability is concentrated along the horizontal axis, i.e., 0 comments.
- The red line is the regression line.
- On the one hand, it is statistically significant, i.e., probably real: the F-statistic for the overall regression has p∼0.013, and the t-statistic for the slope coefficient does as well.
- However, the strength of the prediction is miserable with an adjusted R2∼4.7%, i.e., log hits explains only 4.7% of the variance in comments.
Call:
lm(formula = PostComments ~ log(PostHits), data = postData)

Residuals:
    Min      1Q  Median      3Q     Max
-1.5449 -0.6236 -0.3917 -0.1161  5.1791

Coefficients:
              Estimate Std. Error t value Pr(>|t|)
(Intercept)    -0.9539     0.5943  -1.605   0.1114
log(PostHits)   0.3514     0.1388   2.533   0.0127 *
---
Signif. codes:  0 ‘***’ 0.001 ‘**’ 0.01 ‘*’ 0.05 ‘.’ 0.1 ‘ ’ 1

Residual standard error: 1.22 on 109 degrees of freedom
Multiple R-squared:  0.05558,	Adjusted R-squared:  0.04691
F-statistic: 6.415 on 1 and 109 DF,  p-value: 0.01274
It seems clear that a naïve linear model is useless here. While the nonzero comment points may have a mild trend, the 0 point comments drag the regresion into sillyspace. Perhaps something like tobit regression would be more appropriate? A topic for next year.
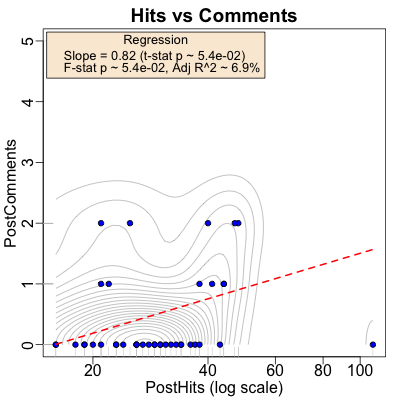 If you look back at 2020 only, you get similar results, except with even fewer hits. Keep
in mind, though, that hit counting only started in mid-2021. So all these hits represent
people looking at the back catalog of posts. They might even be mostly me, referring to
back posts to remember what they said, proofreading for errors, etc.
Call:
lm(formula = PostComments ~ log(PostHits), data = postData)

Residuals:
    Min      1Q  Median      3Q     Max
-1.5668 -0.5196 -0.3024  0.1673  4.0961

Coefficients:
              Estimate Std. Error t value Pr(>|t|)
(Intercept)    -2.2610     1.4041  -1.610    0.115
log(PostHits)   0.8175     0.4115   1.987    0.054 .
---
Signif. codes:  0 ‘***’ 0.001 ‘**’ 0.01 ‘*’ 0.05 ‘.’ 0.1 ‘ ’ 1

Residual standard error: 0.968 on 39 degrees of freedom
Multiple R-squared:  0.0919,	Adjusted R-squared:  0.06861
F-statistic: 3.947 on 1 and 39 DF,  p-value: 0.05402
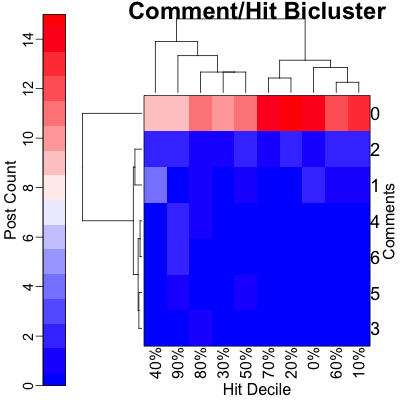
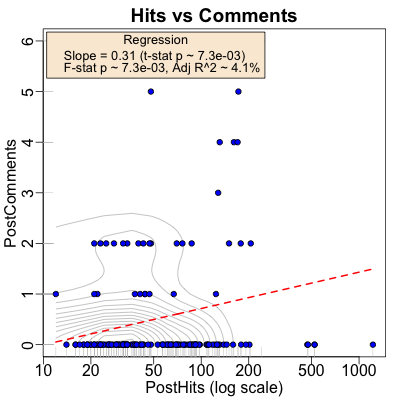 Finally, we can also look at the overall model from
Fiat blog in mid-2020, through the end
of 2021. It appears the conclusions are unchanged from those of 2021 alone:
- The 0-comment posts cluster apart from the others in the comment/hit bicluster.
- The regression model, while statistically significant, only predicts about R2∼4.1% of the variance in comments from knowledge of the hits.
Call:
lm(formula = PostComments ~ log(PostHits), data = postData)

Residuals:
    Min      1Q  Median      3Q     Max
-1.4949 -0.6135 -0.3633 -0.1746  5.1475

Coefficients:
              Estimate Std. Error t value Pr(>|t|)
(Intercept)    -0.7223     0.4664  -1.549  0.12355
log(PostHits)   0.3118     0.1147   2.719  0.00732 **
---
Signif. codes:  0 ‘***’ 0.001 ‘**’ 0.01 ‘*’ 0.05 ‘.’ 0.1 ‘ ’ 1

Residual standard error: 1.16 on 150 degrees of freedom
Multiple R-squared:  0.04698,	Adjusted R-squared:  0.04062
F-statistic: 7.394 on 1 and 150 DF,  p-value: 0.007318
Let’s back up and think about that for a second, in more pedestrian correlation terms. If we do a Pearson correlation test between PostComments and PostHits, we get p∼28.5% and a correlation of R∼0.08, obviously not significant:
	Pearson's product-moment correlation

data:  postData$PostHits and postData$PostComments
t = 1.0724, df = 151, p-value = 0.2853
alternative hypothesis: true correlation is not equal to 0
95 percent confidence interval:
 -0.07274505  0.24227258
sample estimates:
       cor
0.08693659
But wait: we took the log of hits, to cope with outliers. The corresponding thing in a correlation test would be rank ordering, i.e., a Spearman correlation test. That gets us p∼7.7% and ρ∼0.14, which is almost significant:
	Spearman's rank correlation rho

data:  postData$PostHits and postData$PostComments
S = 511325, p-value = 0.07706
alternative hypothesis: true rho is not equal to 0
sample estimates:
      rho
0.1433711
So there might be a relationship here, but it’s between nonzero comment posts and their hits, obscured by the morass of 0-comment posts. So… consider the 0-comment posts as left-censored, and try tobit regression? Maybe next time!
Conclusion: Most posts get 0 comments. While there is statistical significance to a putative comment/hit relationship, the strength of prediction is essentially nothing. A more signficant model involving cutoffs, like tobit regression, will be fun to explore at in year-end post for 2022.
The boring nature of spam and the (blessedly infrequent) nastygrams
There’s still lots of spam, mostly in Russian. I haven’t broken it down by year (perhaps I will do so next year?), but overall nearly every comment submitted is spam.
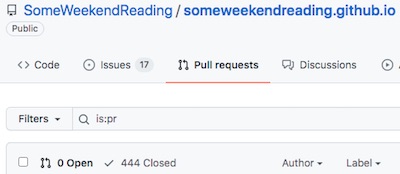 Last year I did a spiffy little analysis by hand-removing my own comments, that I submitted to
respond to others. I won’t do that here, because I haven’t automated it yet. So without
breaking down by year and removing my own comments, we have 444 pull requests (see image
of the Pull Request tab from the blog’s GitHub repository). There have also been 79
accepted comments (including my own, bogusly), as seen in the table up at the top.
Assuming comments arrive with a certain binomial probability p, our Bayesian posterior Beta distribution on p assuming a uniform uninformative prior is:
> 100.0 * round(qbeta(c(0.025, 0.500, 0.975), 444 - 79 + 1, 79 + 1), digits = 3)
[1] 78.4 82.1 85.5
So the probability a pull request is spam or other worthlessness is 82.1% with a 95% confidence interval of 78.4% – 85.5%.
Conclusion: The spammers are persistent but hopeless, since I let absolutely none of it through. It’s impressive their bots can get past my bot filter in the comment form, but unimpressive that they never, ever learn.
Google search console and its discontents
We can also use Google Search Console to see things like how often we come up in Google searches, what the search queries were, how often people clicked through, and what other web pages link to us.
Search appearances and click-through rate
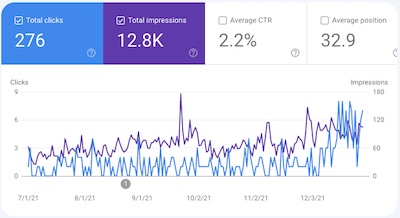 The plot (click to embiggen) shows the number of times we appeared in a Google search
(purple line, right-hand vertical axis) and the number of times there was a click through
(blue line, left-hand vertical axis).
We have a pretty low click-through rate of 2.2%, which means as far as Google searchers are concerned, this really is a crummy little blog that nobody reads. And I’m still ok with that.
As with last year, most of the clicks were from the Anglosphere, the top countries being: US, UK, Canada, Australia, Germany, India, Phillipines, Spain, Sweden, Austria… My former French colleagues are conspicuous by their absence! (Maybe they’re reading, just not searching for this blog via Google. Yeah, that’s the ticket.)
By device, there were about 2.5x as many clicks on a desktop computer as mobile. Tablets were just a minor contribution. Google says this crummy little blog that nobody reads is mobile-friendly, but it looks much better on a real screen instead of a dinky little phone screen.
Search queries
The Google search queries that got click-throughs to this crummy little blog that nobody reads are just plain weird:
- The highest one, at 72 clicks, was “yle editrix”. That’s a mash-up of the abbreviation for Your Local Epidemiologist and the Weekend Editrix. I mean, they’re both smart women, but… ϜΤΦ?!
- Next at 10 clicks was “hank green vaccine” or “hank green covid vaccine”, a réprise of last year’s result that posts mentioning Internet-famous people draw large amounts of clicks. Celebrity culture in action.
- Next was “filibuster statistics by party”, which is the first one that makes sense: it was something I actually wrote about!
After that, it’s just minor stuff with 1 click each for various inanities.
Linked pages, link text, and link text
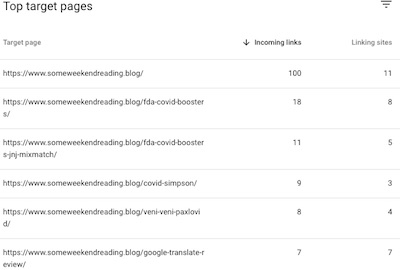 The outside link report says we are linked to by 224 unique outside links. Most of them
link to the front page, along with some others about FDA hearings on COVID-19 vaccines and
therapeutics. I guess that makes sense.
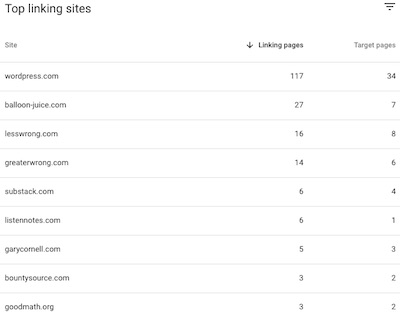
The sites from which those links come make sense, mostly. Wordpress.com is the host for most of the web nowadays, and a couple blogs on which I comment use that (notably TheZvi). Balloon-juice.com, LessWrong.com, goodmath.org, GaryCornell.com, and so on are other blogs where I’ve left comments. (GreaterWrong.com appears to be an alternative format mirror of LessWrong.com.) There are, of course, also a few weird linking sites that appear to be pointless link farms.
I don’t do any promotion for this blog: no Twittage, no Instagrammaton, no FaceBorg, no TankTuck, no YouTubby, no nothing. I don’t even have social media accounts like that. The only things I do are (a) mention it to people in conversation or email when it’s relevant, and (b) very occasionally leave comments on somebody else’s blog. The linking sites confirm this, being mostly places I’ve left comments on other blogs and the few inevitable internet weirdos. (Am I an internet weirdo? Quite possibly…)
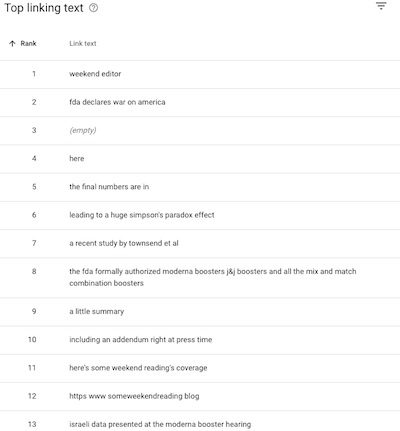 Finally, the text they put in their links to this blog is… puzzling. I’m just
looking here to see if people refer to me as “that idiot”, or something equally amusing.
- The most frequent, understandably, is my nom de blog: Weekend Editor. Fair enough.
- But the second ranking one is “fda declares war on america”. I think that guy is probably not paying attention to what I say? Or invoking me as a counterexample to his position?
- Some of the rest I recognize as links other people have put in their blogs, linking back to me.
- And, of course, this being the internet, some are just bizarre and incomprehensible: “” (the empty string), “11”, “three”, “two”, “alain alameddine image” (apparently a French translator?), “rankvirus com”, “tarekomi xyz”, and so on.
Conclusion:
- Ok, it’s not like nobody reads this blog. There are a few readers, small in number but deeply crazed. Sort of like me.
- Google search hits are more or less useless, with a low click-through rate based on people looking for internet-famous personalities.
- Most readers are in the Anglosphere, and use desktops or laptops, a few phones and almost no tablets. I’m vaguely disappointed to have so few French readers.
- Linkage comes mostly from places where I’ve left comments and gotten (very minor) notice.
The Weekend Conclusion
Modulo a few more hits on popular posts, pretty much the same as the last time we took stock:
This is still a crummy little blog that nobody reads.
And I’m still ok with that.
There are a few links, mostly from the comment sections of a few blogs we’re I’ve dropped in to say something. I’m not interested in doing promotion work, or monetization. I might look into Google Ads and some minor promotion someday, once I get the stylesheet stuff straightened out, but also maybe not. So don’t hold your breath on that.
To my spammers: You’re hopeless. You’ll never make it past moderation. Move along.
To my readers (all 3 of you, excluding my spouse, my cat, and myself): Thanks for reading. I’m gratified at the couple of you that have expressed interest. Please feel free to leave comments; it makes me happy to engage with thoughtful people.
Notes & References
1: WeekendEditor, “R script to analyze post statistics”, Some WeekendReading blog, 2022-01-01. ↩
2: WeekendEditor, transcript and spreadsheet for calendar 2020 posts, Some WeekendReading blog, 2022-01-01. ↩
3: WeekendEditor, transcript and spreadsheet for calendar 2021 posts, Some WeekendReading blog, 2022-01-01. ↩
4: WeekendEditor, transcript and spreadsheet for all posts mid-2020 through year-end 2021, Some WeekendReading blog, 2022-01-01. ↩
Gestae Commentaria
Here’s hoping for 2022: maybe it’ll be better than 2021 on all sorts of measures, including the number of genuine comments on this blog?
Yes, though I admit blog comments are a rather more trivial goal.
Stopping the pandemic, stopping the threats to democracy worldwide, figuring out US health insurance… and a hundred other things. It’s a daunting list!
I found you via Zvi, and added Weekend to my RSS feed (feedly). Not sure how we/I are/am reflected in your metrics.
At any rate, Out with the old. I look forward to what this New Year brings, to this blog and to real life. A resolution: at least one comment of substance here, in the next 365.
Woo-Hoo! Welcome to the Weekend Commentariat, AMac78.
And thanks: my blog analysis script (reference 1 above) no longer gets divide by 0 nonsense when computing DaysPerComment for 2022… :-)